Recently, I have received several emails asking for more details about how to price things in gold. Here is one example:

Greetings Sir Charles,

I've just discovered your blog on prices in gold, and I found it very interesting.
However, now I am curious about how the amount of gold a specific good costs is calculated.
I was just wondering if you could give me a brief explanation to help me to understand.

Thank you very much for your time!

Agustin Alvarez
Argentina

¡Hola Agustin!

The process is very simple in theory: just divide the price of something in currency by the value of gold in that same currency on the same date.

For instance, suppose I bought a house for USD 100,000 on June 23rd, 2003. Gold on that date was USD 355 per ounce. So I paid 100000 / 355 = 281.69 ounces of gold for my house. This means I had a choice: I could have used my $100,000 to buy 281.69 oz of gold, or to buy the house. Or perhaps that I had to sell 281.69 oz of gold to get the money to buy the house.

Today, I might be able to sell the house for USD 200,000. But gold today has a price of about USD 1,700, so the price of the house today might be 200000 / 1700 = 117.65 oz. On paper, in USD, I have doubled my money. But that money will buy 58% less gold – and also less food, less gasoline, etc. Not a good investment.

To build a chart, just collect a set of prices with their dates in a spreadsheet, and convert each one to gold by dividing by the gold price on that date. I usually use the London PM fix price, which can be found at the LBMA website. The resulting gold price table can then be converted to a chart by the spreadsheet program.

I offer custom charting which is great for long term charts, and charts of hard to find items, but to price financial assets, like stocks, you can also use the excellent StockCharts.com service. Simply enter the symbol of the security followed by ":$GOLD". This will do the conversion for you, plotting the prices in ounces of gold. These charts are very detailed, showing high, low, open, close, volume, and many technical studies. For example, here is a "SharpChart" of Microsoft (MSFT) priced in gold, as of 2-Mar-2012:

Sample StockCharts.com chart of MSFT in gold

This chart shows that if I had bought 100 shares of MSFT in early December, I would have paid about 1.45 ounces. If I sold those shares today, I would get about 1.85 ounces of gold for them – a profit of 27% in just 3 months! Sweet! This is why we invest: to grow our wealth in real terms, to "grow our gold". Of course investing carries risk as well, as the house example demonstrates.

For safety of savings, or when out of the market, keep your cash in gold. When investing, have a money management strategy that will get you out before losses (as measured in gold) become too great.

I hope this is helpful!

Saludos,

Sir Charles

Filed under monetary universe by  #

I'm getting calls to the Priced in Gold hotline, emails, questions from friends – all asking the same thing: "Have you seen the 2011 Berkshire Hathaway annual report and Warren Buffet's comments about gold?"

On pages 17 to 19, Mr. Buffet outlines three big categories of investments and comments on each. The first category are "Currency-based", things like bonds, mortgages, bank deposits and so on. He rightly argues that these are bad news in times of declining currency values.

The second broad category are non-productive assets such as commodities, and he uses gold as the poster-child for this asset class. Stored in a vault, these assets just sit there, doing nothing. As Mr. Buffet says, you can fondle them, but they will not respond.

The third category, his favorite, are what he calls productive assets: businesses, farms, and real estate. His assertion is that in the future, the value of these assets will grow enough to provide a real return, even taking currency depreciation into account.

I understand (and mostly agree) with his comments on gold… but he hasn't looked at the investments he likes so much PRICED in gold. He doesn't realize just how much erosion of currency value there is these days – it is much worse than the government and mainstream economists he relies on will admit. So while he is correct that it is theoretically better to invest in companies that can create value and growth, that only makes sense when there is a positive growth climate and stable money… which is not where we are today! Someday, he will be right in spades; but for now, it is much better to be in cash (real cash, that can't be devalued by governments, that is to say GOLD, and maybe silver.)

Take a look at the performance of Berkshire Hathaway stock, as an example. In the 1990s, it did great, making it's shareholders rich compared to buying gold or holding other forms of cash – multiplying their capital invested by 10x or more. But from 1999 to today, those investors have lost more than 75% of their money, as compared to just holding gold. My sense is that they will lose the rest of their gains as well, if they just hold on. Eventually, those BRK-A shares may start to really grow again… but that won't occur until the economy is sorted out and money is once more stable. And that will take some serious doing, and won't happen for a long time, maybe decades. Virtually everyone who bought shares of BRK after 1996 is now in a LOSS position on that investment, as compared to just holding onto a lump of gold instead… Sometimes it is better to just hold cash!

Berkshire Hathaway A Shares priced in gold from 1990

Of course, while BRK has been declining, there are investments that have been growing in true value. Apple Computer (AAPL) is one example. During the 1990s, it held it's value pretty well, but didn't grow the way Berkshire did. But while Berkshire lost value after 1999, Apple began to grow, really picking up steam after 2003. While it is possible to grow your wealth in gold terms, it takes careful attention to what is really happening, avoiding investments that are falling in gold value – regardless of how attractive they may look when measured in depreciating currency – and focusing on investments that are providing genuine returns.

Apple Computer priced in gold from 1990

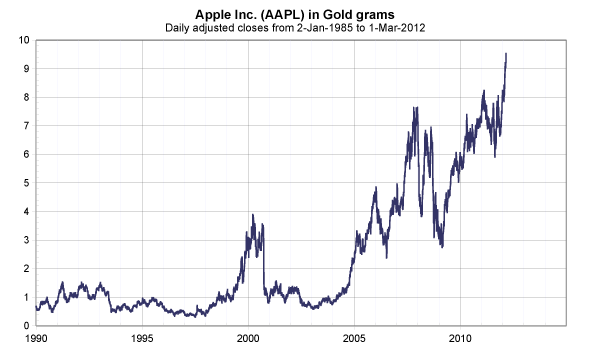
Will Apple keep going up? I can't know the future with any certainty. But I can implement a sound money management system that will keep me from holding investments that are declining in gold value, and I can seek out opportunities that offer a shot at true growth as measured in gold. And until I find a good opportunity, I can keep my capital safe by holding gold rather than depreciating currency or declining stocks.

Some people worry that interest rates are too low, and that as inflation continues to head higher, rates will begin rising, increasing the attractiveness of currency-based investments and hurting the price of gold. While that might create an updraft for the USD and other currencies relative to gold, significant and sustained rises in rates would also destroy the stock markets, the bond markets, the housing markets, and the Government's budgets… so I don't think the central banks will be allowed to take that action any time soon (by which I mean pretty much forever). More likely they will continue the gradual destruction of currency values that has been so successful for decades, until a major war or other emergency gives the excuse to take direct control of the economy and "reset the game" for another round.

If such an updraft develops, take advantage of it to accumulate more gold, or even speculate on rising currency values by trading some of your gold for currency-based assets. But realize that holding government issued currencies and currency-based investments is a highly risky speculation. Gold is where you want to keep your savings, preferably in physical form, safely stored outside your home country.

Eventually, when the monetary insanity has run it's course, government has receded to a much smaller footprint, budgets are in surplus and debts have been defaulted on or paid down, money is stable and interest rates are being set by the free market, and the central banks have disappeared or lost their power, then you should trade most of your gold for solid, growing companies and other productive assets – maybe even some shares of BRK, if it's still around! But not before then.

Cheers,

Sir Charles
Editor, http://pricedingold.com

1

Subscriber Mark Cloney recently wrote to me with some great questions:

Hello, Sir Charles – I have a couple questions for you:

  • How can someone on a tight budget best get invested in silver and/or gold?  I don't have a lot of savings, but I do not want to see them destroyed by more and more "quantitative easing".
  • Seeing that I'd practically have to spend $2000 to get one ounce of gold, would silver be a better way to go?  I know it's price is high too, but maybe more manageable for someone who isn't starting with a large initial investment.
  • I've seen some things where you don't get actual silver or gold in your possession, but a certificate (or something like that) instead.  Are these plans liable to leave investors defrauded or to have the actual metal confiscated by the government?

I know you may have better things to do than answer basic questions like these, so thank you in advance for your time and advice.  If you know of a site or blog that can answer these types of questions, please send me a link.

Thanks again!

Mark Cloney

Here is my reply:

Hi Mark,

Thanks for visiting Priced in Gold.

Re: Salaries – I do track production wages and the minimum wage in gold, as well as per capita disposable income – and they are all UGLY, probably comparable to Great Depression levels, though my datasets don't go quite that far back.  If you have some old paystubs or tax returns, it's pretty easy to figure out your own income history – just divide each value by the price of gold on that date.  Go to the London Bullion Market Association gold fixings page to find the gold price on any date after 1967; before that use $35/oz and you'll be pretty close.

As to how to safeguard your savings using gold and silver, don't worry about the price in USD.  Just buy what you can afford, as often as you can.  Small gold bullion coins (like 1/10 oz and 1/4 oz Eagles, Maple Leafs and Krugerrands) are quite affordable.  The only drawback is that they command a higher premium over their gold content than 1 oz coins, but this is usually recaptured when you go to sell them, so it's not as bad as you might think.

Steer clear of anything collectable or numismatic, unless you are truly a collector and know what you're doing.

Silver also tends to have a larger premium, and it is more bulky to store, but it should work better for smaller "barter type" transactions in a SHTF scenario, especially the pre-1965 "junk" silver dimes and quarters.  But silver is also much more volatile due to it's strong industrial importance, which will tend to pull it down in times of recession.  Beyond some barter coins, I tend to see silver as a speculative investment rather than as savings.

Platinum is another metal than can be a good speculation.  As of early 2012, it is trading below parity with gold, a rare circumstance.  I have been buying a little of it to take advantage of that spread.  If the economy really tanks big time, platinum and silver could go much lower.  But eventually, I think platinum will return to a premium over gold.  Silver might go much higher, but then again, it might not… I think it is a lot more of a gamble, but could have a larger payoff.  So it is strictly for speculation, not for savings.  Since silver was demonetized, it has been subject to several bubbles, as you can see in it's long term chart.  If silver does rise rapidly (perhaps to 1.5 grams/oz – almost triple today's price) the trick will be to get out quickly to the safety of gold before it crashes again.

The key is that the price of gold never changes.  It is the value of the fiat currencies used to "price" it that change.  Gold is not an "investment" that will make you rich.  It is the best form of cash, and will hold it's value, no matter what kind of monetary insanity the Fed and the rest of the central banks indulge in.  Once your savings are in physical gold, in your possession, you have no counter-party risk… only risk of physical theft, which needs to be considered carefully.  Diversification in your storage plan is a good idea – maybe a home safe, some midnight gardening, an overseas storage box, etc.

Paper certificate programs have always bothered me for the reasons you suggest.  As another form of diversified holding, they make some sense, but I wouldn't make them the main event.  For instance I like and use Goldmoney.com, but not as my primary form of gold ownership.  Same goes for ETFs like GLD, PHYS, etc.  Great for trading (shorting the USD) but I don't consider them part of my savings plan.

I hope this is helpful!

Cheers,

Sir Charles

3

On December 6th, US stocks, with the wind of a strong USD at their backs, poked their heads above their lows of 2009 for the second time this year.  The previous attempt was short lived… Will this one fair better?

After the 2008-2009 crash bottomed on March 6th, 2009, the S&P 500 quickly bounced from a low of 22.7 grams to about 30 grams.  Until July of 2011, it traded in a range between 24 and 35 grams, gradually trending lower.  On July 1st, the index peaked at 28 grams and began falling, passing the 2009 low on August 4th. and trading as low as 18.6 grams, 18% below the 2009 low.  It has stayed below the 22.7 gram level with one brief exception: on October 18, the S&P rallied to 23.4 and held above 22.7 until October 31, peaking at 23.6 grams, 4% above the 2009 low.

SP500-2006.png

Let's see if this rally can carry the S&P above the 23.6 gram level.  If so, a further rally to 26, 28 or even 30 grams area might be possible.  Even these levels are well within the downtrend channel established since 2008, however.  A lot hinges on the news coming out of Europe, and how it impacts investor psychology. With limited upside, and lots of downside, I would rather rely on solid gold than risk my wealth on animal spirits.

Filed under Economy, S&P 500, Stocks by  #

0

Priced in Gold reader Shaun C. recently wrote me asking for a chart of investment farmland in gold, and suggesting some sources of data.  This was very intriguing, as I have been considering investments in timberland and farmland for myself.  After a little research, I prepared the following charts, which will be updated quarterly on an Investment Real Estate chart page.  They suggest that farmland is the best place for real estate investment money in the near future, but once the "bottom is in", timberland may be the way to go.

These charts show total returns for various forms of investment real estate in index form.  Over the last 20 years, farmland has returned 70%, timberland 52%, and commercial real estate 0%.

In the period from 1992 to 2001, timberland was the best performer, with returns of 5x the original investment compared to 2.8x for commercial property and farmland.  Since 2001, however, commercial real estate has given back all of those gains, timberland 87%, and farmland only 61%.

Compare these performances with US Homes, as measured by the Case-Shiller CSXR index, which is currently 60% below it's 1992 level.

Farmland has held it's value for most of the last decade; the majority of it's losses have occurred since 2009.

National Property Index from 1978 to Present:


NCREIF Timberland Index from 1987 to Present:

NCREIF Farmland Index from 1992 to Present:

Last Week of November, 2011

The end of November saw more losses for currencies, especially the Japanese Yen, which dropped 4%.  Bonds were lower, while equities climbed.  Commodities were mixed, with copper rising 4.8%, the largest increase of the week.  Coffee and cotton were lower.  Coffee, down 4.4%, was the second biggest loser after long bonds, where TLT was down 4.9%.

One commodity not tracked in this table is Platinum, which made a new all time low this week.  As further signs of global recession appear and deepen, this industrial metal may see further weakness, but I feel that any price below parity with gold represents a good long-term buying opportunity.

What stands out to me in this table is that the only thing that is up year over year is TLT.  And it isn't just this table – I've gone through every one of the charts I track, and TLT is the only thing that is up for the last 12 months.  Of course, longer term, TLT has been a terrible investment… but the Fed keeps pushing interest rates lower, and the bond market continues to be seen as the last "safe refuge" for the large capital flows seeking to escape from a crumbling Europe.

My prediction is that as the situation in Europe adjusts to its "new normal", and the ECB and Fed continue to issue currency to paper over the rotten core of the financial system, gravity will once again assert itself, and the currencies in which bonds are issued will fall much faster than the bonds can grow in nominal value.  And if the "Bond Vigilantes" ride again, pushing interest rates up to the levels where they really should be – look out below!

US Bonds were higher this week, recouping last week's losses and more. SHY gained 3.1% in line with USD strength, and TLT gained 6.4% reversing last week's 2.1% loss. Over the longer term, TLT is now up for the year, while SHY is down around 20%. As the crisis in Europe deepens, US Treasuries may make further gains; but keep in mind that these are highly volatile speculations, not a safe place for your savings or a good source of income.

All the major currencies bounced this week, though they are still down YTD and for the last year. The weakest was the EUR (recovering 2.4% of last week's 2.6% drop) reflecting hopes that the crisis in Italy and Greece has been resolved. I am not holding my breath. JPY was the strongest, up 4.1%.

Stocks were mixed this week, with the Dow up 0.1%, the S&P 500 down 0.8%; gold stocks as measured by HUI were down 5.4%. Japanese stocks were slightly higher, with the Nikkei up 2.4%. All four indices are much lower YTD and from one year ago, with the Nikkei leading the way, down 29%.

The Dow and the S&P 500 remain below their lows of 2009 (3.2% below and 2.4% below respectively) in spite of their nominal "gains" when measured in ever depreciating dollars. Japanese stocks are more than 20% lower. Gold stocks, which bottomed in late 2008 at 6.45g, are now trading 64% higher at 10.6g.

Commodities were mixed, with crude oil and coffee rising again this week. Copper regained some of last week's loss, up 3.8% this week. Silver and cotton each declined 1.5% for the week.

All the commodities on our list are lower YTD and compared to a year ago, with cotton showing the most weakness (down about 45%) while silver and crude oil show the least.

The week in gold

Filed under monetary universe by  #

1

As the wheels come off in Europe, be prepared to take advantage of any pull-backs in physical gold, silver, platinum, and in mining stocks.

Volatility is high as rumors circulate about the latest bailout plan, change in leadership, and massive public demonstration. Do not let this fool you: governments will create the currency to kick the can down the road. It's a game of musical chairs, and nobody wants the music to stop on their watch.

But it's not an all-or-nothing game, either. Especially in Europe, there are many possible outcomes: dramatic restructuring into a United States of Europe with countries essentially devolving into provinces; Germany pulling out and leaving the rest of Europe to fend for itself; some or all of the PIIGs getting kicked out of the euro and reverting to their former currencies; and so on. What all of these scenarios have in common is massive currency debasement.

Bad debts have to be liquidated, one way or another. And while that sounds deflationary, it will trigger currency creation in unheard-of proportions as the "too big to fail" banks, corporations and governments are kept afloat.

Keep an eye on the half-life of the dollar:

The week in gold

There is plenty of room at the bottom of this chart for a gradual default on all the debts, public and private, that can never be paid back in honest money. But don't be surprised when at some point, maybe next week, maybe next year, or maybe next decade, the markets suddenly wake up and smell the coffee – and realize that they have been conned. By that time, you want to be as far away from fiat currencies as possible.

Also expect a gradually tightening noose of capital controls, increasing taxes, and encroachments on civil liberties as standards of living fall. All these things will be done "in your best interest", to "create jobs", to keep you "safe", and make sure "the rich" pay their "fair share". This gradualism may also give way suddenly to a declaration of war, a state of emergency, martial law or an outright dictatorship – possibilities you have to prepare for.

Watch for buying opportunities and continue to accumulate physical gold, silver, platinum and high quality resource stocks. Diversify your geopolitical risk by having some of your savings (precious metals and investments) outside of your home country. Have a place which you and your family enjoy that you can slip away to if necessary. Hope for the best, but prepare for the worst!

This Week's Market Action

All the major currencies are down for the week, YTD and for the last year. The weakest was the EUR (falling 2.6%) reflecting increasing concerns about Italy, Greece, and the whole future of Europe. JPY was the least weak, down only 0.9%.

Bonds were lower again this week, with SHY down 1.4%, and the 20 year TLT dropping 2.1%. Over the longer term, TLT is close to breaking even for the year, while SHY is down around 20%.

Stocks were little changed for the week, with the Dow up 0.05%, the S&P 500 down 0.5%, and HUI up 0.8%. Japanese stocks were the exception – sharply lower, with the Nikkei down 4.2%. All four indices are much lower YTD and from one year ago, with the Nikkei leading the way, down about 30%.

The Dow and the S&P 500 remain below their lows of 2009 (3.2% below and 2.4% below respectively) in spite of their nominal "gains" when measured in ever depreciating dollars. Japanese stocks are more than 20% lower. Gold stocks, which bottomed in late 2008 at 6.45g, are now trading 64% higher at 10.6g.

Commodities were mixed, with crude oil and coffee rising, while copper, silver and cotton declined for the week.

All the commodities on our list are lower YTD and compared to a year ago, with cotton showing the most weakness (down over 45%) and silver the least (down only 4% for the year so far).

The week in gold

Filed under monetary universe by  #

In early September, gold was over $1900, and seemed ready to push for the $2000 level. By the end of September it had fallen to $1650, after dipping as low as $1550. Since then, it has continued to trade in the mid-1600s. Is this the beginning of a gold crash? Is the "gold mania" now behind us?

Back in March, I discussed the Half Life of the Dollar. In that article, I pointed out that the USD has been losing half of it's value every four years… and that trend remains solidly in place. But currency value decay, like radioactive decay, only appears smooth and steady when you stand back and look at the overall curve. Examined in fine detail, it comes in fits and starts, and with plenty of ups and downs!

USD prediction chart

A short-term uptrend in the midst of a long-term decline is known as a bear market rally. What might such a rally look like this time?

The USD's 200 day moving average is now 20.6 mg, implying a $1510 gold price – a level we have almost reached. If that resistance level is tested and holds, the rally may be over soon.

But when the USD hit its all-time low of 16.4 mg on September 6th, it was almost 24% below the level predicted by the half-life decay curve. In order to return to the curve, the dollar would have to rally to 21.4 mg – equivalent to a gold price of $1450 in USD. And there is no reason a rally should stop there; some overshoot should probably be expected before gravity reasserts itself and the USD resumes its downward trend. An "equal and opposite" over reaction of 24% could carry the USD to 26.5 mg – equivalent to a gold price of $1172.

Concerns about Europe and a global economic slowdown are causing investors to shift away from risk and towards the safety of cash positions. For some, this means liquidating gold positions. But for many, it means adding to gold positions. Metals without gold's monetary pedigree, especially silver and platinum, will probably trade lower in gold terms, creating significant buying opportunities. Resource stocks may also be hit hard, giving buyers a chance to scoop them up at bargain prices.

There are absolutely no signs of any real fiscal or monetary reforms anywhere in the world. Even the Swiss have abandoned their conservative economics and pegged the CHF to the EUR – tying their currency to a sinking ship. The tsunami of money creation I expect to see in the next few years will sweep all of the world's government controlled currencies to new lows… And you want to be on the high ground of gold and other tangible assets when that wave hits.

Take full advantage of this rally in the USD, EUR, and other paper currencies to maximize your risk-free gold holdings and increase your exposure to assets that will grow in gold value as governments seek to outdo each other in providing economic "stimulus" in the months ahead.

Filed under monetary universe by  #

Thanks to a comment from reader Michael H, I tracked down Yale professor Robert Shiller's long term home price series and repriced it in gold. This has been added to the US Home Prices chart page.

It is fascinating to see that home prices are now lower than at any almost time since 1890, even lower than the depths of the Great Depression of the 1930s… The one brief exception being the dramatic "undershoot" of the USD's value in 1980, following the massive stagflation of the 1970s triggered by the removal of gold backing of the USD.

I have also added a chart page which will give a weekly update on a few major currencies, equity and debt markets, and commodities. As I am traveling this weekend, there may be a hiccup in updating it until the following weekend, but I will try to keep it up to date following that.

Last week, the EUR was weak, falling 0.8% while the USD strengthened by 1%. Reflecting the USD's strength and a lack of viable alternatives, short term bonds rose 1.1% and long term bonds rose 2.1%. All of the currencies are still dramatically lower YTD and from a year ago, however.

Stocks were lower, especially the Nikkei 225, which fell 1.9%. THe exception was gold stocks, with the HUI posting a 2.7% gain.

Commodities were mixed, with cotton leading the gainers, up 4.6%, and coffee leading the losers, down 5.2%. Silver was off 1.6% while crude oil and copper showed gains of 2% and 0.4% respectively.

One commodity I would be looking closely at is platinum. It is currently priced below parity with gold, a rare occurrence… and I suspect that although dramatic economic news might push it lower still, in the medium to long term, it should revert to its customary premium to gold, making it a great way to "grow your gold".

Filed under monetary universe by  #

The last few days have been a wild ride for investors. With cracks in the Eurozone widening, new Fed promises of ultra low interest rates for the foreseeable future, riots spreading across the UK, and continuing unemployment in the US, there can be little doubt that massive currency debasement is now "baked into the cake".

Markets have reacted by a move to the safety of gold – the only true cash position – and away from the risks of most currencies, stocks and commodities. Major currencies are at all-time lows. Commodities, while down hard, are generally still higher than they were at the bottom of the 2008 credit crisis. Major stock indices, however, are lower than they were at the bottom of the last crisis.

Here is a quick scan of the markets, priced in gold, as of August 10th:

USD: 17.55 mg, a new all-time low
CAD: 17.68 mg, a new all-time low
EUR: 24.98 mg, a new all-time low
JPY: 0.227 mg, a new all-time low

Silver: 0.672 g/oz, has given up all it's YTD gains, but is still 82% above its 2008 lows
Platinum: 30.79 g/oz, is now cheaper than gold for the first time since December 2008
Copper: 155.40 g/tonne, is still 57% above its 2009 low of 99 g/tonne.
Crude Oil: 1.46 g/bbl, is 30.3% higher than its 2009 low
Coffee: 41.22 mg/lb, is down 22.3% for the year so far
Cotton: 17.38 mg/lb, down 63% from its 2011 high, but still 30% higher than its 2009 low

Dow Jones 30 Industrials: 188.16 g, down 26.3% YTD, and 14.6% below its 2009 low
S&P 500: 19.67 g, down 29.1% YTD, and 13.4% below its 2009 low
NASDAQ Composite: 41.79 g, only 2.2% below its 2009 low
AMEX Gold Bugs: 9.69 g, down 23% YTD, but 50% higher than its 2008 low

Short term bonds, as measured by the SHY fund, are at all-time lows. The long term bond fund, TLT, although almost as high in USD as it was at the height of the 2008 credit crisis, is worth less than half as much gold.

Some stocks are doing very well. AAPL, for instance, has given up most of it's gains for the last year, but it is still worth more than twice what it was at the bottom in 2009.

The federal minimum wage is now 127 mg/hr – the lowest it has ever been. When introduced in 1938 at 25 cents/hr, the rate was 222 mg/hr!

My advice is to stick with the safety of gold. This is the time to be in cash, and certainly not the time to be in risky fiat currencies. Platinum may be a decent speculation, however. It is very unusual to be able to buy an ounce of platinum for less than an ounce of gold. While it may get cheaper still if the economy continues to weaken, I think platinum's relative rarity and many important industrial uses make it worth the risk over the long term.

Filed under monetary universe by  #