Horse crap. Are you claiming that the US outputs half of what it outputted six years ago?
Gold is a commodity, like any other, and is currently in the midst of a speculative bubble, and it is this surge in speculation that has caused the apparent decline in US GDP that your chart displays.
Hi Bob. This site has the focus on gold pricing, but the data you need to price in other commodities is freely available. For example, oil prices can be downloaded from http://research.stlouisfed.org, and GDP from http://www.bea.gov. I think you'll find that GDP priced in oil (or silver, or copper) looks quite similar to GDP priced in gold. Good luck!
Cool Chart, really illustrates the hoax that GDP is when put in a commodity its waaaaaay down. Would be nice to see some sort of honest aggregate like oil, wheat, silver, gold, copper etc all together, im sure the curve would be the same in general but a bit softer. You know things are really bad when you can look up US GDP output and see that even in their bogus terms its falling. In real terms its catastrophic.
tom is wrong, i think. It doesn't matter if gold is in a speculative bubble, dollarwise. These comparison charts remove dollars from the equation, purely comparing values as if gold were traded directly for the item in question. The dollar is only used to find current prices, which simply illuminates what the markets are deeming each commodity's worth to be.
I don't see how these numbers can lie. GDP, if accurately reported, is a dependable figure. Gold is a commodity with a price. The fact is, this chart shows the that the price of gold versus the price of the GDP IS THIS. period. Speculative bubble or not, everybody is in agreement with what gold is worth in dollar terms, or its price wouldn't be what it is. it functions at that level.
And is it so outrageous that the US can't produce product at an infinitely expanding rate? Nothing grows forever
I bet Tom is wishing he had invested in the gold "bubble" back in '08….like I did. Our GDP has been inflation driven not growth driven. The government has the incentive to cover that up…. smaller payouts to SSI. Even today they are still saying there is virtually no inflation, welcome to the real world.
Less and less items produced by this country are worth its weight in gold.However, poroduce we must. Ever more dubious means of exchange for ever more dubious goods and services-mostly services these days-keep people off the streets too exhausted to notice a decrease in standard of living(and of wealth) that the plunging curve signifies.
I Know a person that bought a house in Jersey Wycof area in 1950 for 20K 2K down at 2.1% for 30 years. Sounds about right. Disorganized desperate workforce and teabagger cuts spell only one thing DEFLATION.
If you want a graph which measures GDP in terms of a more honest aggregate then just find a graph plotting the US Real GDP. Measuring the US economy by the amount of gold it can buy is absurd. Its just a rather complicated way of showing the change in the price of gold relative to the growth of the US economy.
And yes the price of gold has increased a lot relative to everything. This is largely due to it being a focal point for investors in times of uncertainty. It will come crashing down if/when the global economy recovers. The price of gold is very volatile, it has crashed before and will crash again. If you are holding it be ready to jump, but if you don't know that already there's no chance that you'll jump in time: people who are well informed and speculating by investing in gold will be able to sell their gold before you when the market takes a down turn. They will have made a lot by investing in gold, you probably won't have: the lucky people who bought back in 2005 or earlier will probably do no worse than break even. After that who knows.
TRUE, gold is strictly buy and hold (forget). No Day Trading Here!
The only reason Europe did'nt sink yet is because the principal players (Excluding Eastern Europe) are sitting on TozNS of Gold. These guys are not selling any time soon. (Debt Shmebt). We'll monetize it while keeping middle class strugling (paper with immages on it being recognized(marketed) in exchange for survival). Meanwhile in the US – we produce Chevys with front brake pads missing. Produce we Must = survival.
The Question Is What will US standard of living Look Like when Equilibrium is reached, i.e. when US GDP is more valuable tnan gold.HOUSTON, Hope there is no pocyclipse in the equation!
When did the current fall-off start? It looks like it was about 2001-2002. The economy was able to run on fumes for another five years or so, but eventually reality bit us in the you-know-where. It's really surprising that the drop-offs are that sharp.
Yes indeed, The 2% or so FED sponsored inflation showes in the goods and services – mostly services- output of US. The capital markets do not invest in factories or rails or stuff, its all QUants run casino where the probability of trend up or down is the basic reason for investment. This is leveraged to the hilt. 700 Trillion – probably more, we talking Quintilions. This is the reason why JPMChase still makes profit after loosing 10 billion.
These are huge ammounts racing in the algorithms. From what counterparties do they suck up the gains? Looks like Masterbation to me. Houston!, you playin with yourself while we crash?
Captain All I am suggesting is that if you increase your power by 2% and the Thalians Web cavitational vortices increase by 2% you get 0% net movement. Look what happened to Capt. EuroDecker. He Decided to cut power and now He is stuck to the Web and slowly being digested in the trap.
I would suggest to remove the Ferenges from the anti-matter reactor room and do some di-lithium redistribution and increase the warp factor without (this has no meaning to us Vulcans) overflowing the toilets.
The US GDP is dropping at an alarming rate, also in dollars ( not inflated dollars ) John Williams Shadow Government statistics shows it is dropping at around 2% a year, since 2000?
OK, Ben B. opened his mouth and mini crash followed. President O. made references to Ben B. being history on C. Rose (true gem on PBS). Ben B. shut up and coughed up another 100 B. a Month to keep everybody happy. You Don't Have to be a Vulcan to see the logical conclusion to this. Or mabe you have to be a Vulcan.
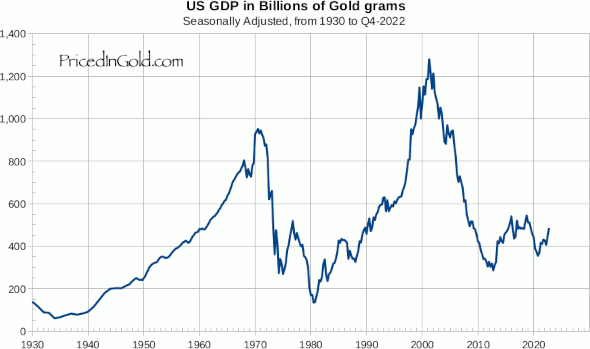
There are a lot of ways to slice and dice this one… For starters, the entire concept of GDP is bogus, and of questionable value. You can’t “buy” a country’s GDP; it’s a theoretical summation of all of a country’s transactions. This also implies a velocity component (the money transacted gets used multiple times). GDP is usually “deflated” by a heavily massaged (and thus extremely understated) price index number. For this chart, I have chosen to use the gold price as the deflator instead.
"You can’t “buy” a country’s GDP; it’s a theoretical summation of all of a country’s transactions." That is correct, It is not subject to Supply Demand markets. However massaged, it shows-if massaged according to consistent rules and compared to gold-the relative wealth of a nation. Right now US Goods and Services is 10% Goods and 90% Services.
Sooo what that mean? The Future of US depends on 10% manufacturing and the rest depends on my travel agent calling my tennis coach so together they can open a nail salon. And it shows.
This is a Didn't Shouldn't Question:
Didn't Gold Burst a bubble recently and Shouldn't we be getting a spike in GDP Worth?
Could it be that Gold and GDP went into the toilet at the same time?
I am just pointing out It Could be that US GDP is draging down the price of gold-WOW.
It's good to be in the 0.1 % right now.
@James Best: I hope your right this way I can buy, but the reality is that the last time gold went on a long term downturn, was when volker set interest rates to above 20%. Nowadays The US can't afford anything but 0% interest rates.
One phrase comes to mind – LIQUIDITY TRAP. Uniform misery. Bouncing about The bottom.
The 64 bitcoin Question what to do other than WAR?
It's good to be in the 0.1 % right now.
Kapt'n I am merely stating that the Hollowed Out Economy is swallowing up Huge amounts of stimuli-both "seecret process" Paper(Mentally associated with surviva) lndeeded and the Economy "is really great" media psychobabble for this logically to be anything but a vitual Liquidity Black Hole. Scotty you got some of that Single Malt Klingon Killer, Thats for the human half.
@Tom:
Gold is not in a speculative bubble, and Gold price per ounce surge is not disfavoring the GDP. The federal Reserve is destroying the value of the u.s dollar ever since its founding in 1913. The proper way to value a currency ( not taught in school) is to equate $1 to 1 ounce of gold. if that was the case then we would not be in a recession every now and then. The federal reserve manipulation of the price of money is what is killing the dollars' value and so the Government added to that by over spending, which throw their annual budget out of balance ever from the time their over spending began. Check the figures of the debt increases from WW1 TO WW2 and the Korean war, the Vietnam war, military bases all the world, the Iraqi war of 2003 plus war on terrorism. All these things cost money. The money the government uses is called "borrowed money with a price". The federal reserve is the sole non-government agency that set the price of money for the government bonds and the discount rate for the commercial banks. The fed's ability to print more currency eats away at the purchasing power of previous dollars lent out by them. In so doing creates price inflation which inflates certain assets classes and set the precedence for a rate increase. If the rate keep moving up and down as the fed see fit, then what we will have is the devaluation of the currency overtime.
The surging price of gold per ounce is telling you something about the dollar's value at hand. Investors who know what the fed is doing, is edging themselves against the devaluation of the dollar, the u.s government is also adding to the escalation of a u.s dollar default. International creditors will sooner and later decide to create a run on the dollar and rush to get as many gold bullion as they can to avoid their paper holding from being wiped out. The Gold price is reflecting common sense, while the price is no too high get more of it before it does. The reasons why the U.S GDP output declines is because where the commercial banks chose to allocate credit is in those firms that have invested a part of that money the equities market which as you know have an element of risk. Most of the money is not going to finance new business start ups and manufacturing. With out those two pillars erected and maintain the country will not have the manufacturing facility to be producing more out put. As a result GDP output falls, but prices will keep rising as business try to acquire more revenues through their sales column as a result the GDP will appear as if it is increased. The GDP comes at a cost, that cost goes back to the price of money control by fed. When the lowers the discount rate it is only for a short term , then when the inflation in prices sets in again on the market, they will increase the discount rate incrementally, the fed funds rate is set either.25 basis points or sometimes .50 basis point below the discount rate, the prime loan rates will be set by the individual commercial banks which in turns set the real price of money to the overhaul economy. These rates will reflect themselves in the prices of good & services that quantifies the GDP. If the GDP true output as fallen, it is because of the increase in the cost of loans.
Businesses will cut back on what they can spend, and add that to their bottom line where they can, not in all cases though. The inflation rate must be subtracted from nominal GDP estimated growth rate so we can have the real GDP GROWTH RATE. the inflation rate serves a factor of the GDP Deflator. The inflation rate added together with a CPI INDEX base year.
For example; If inflation rate is 2.5% then convert that to a decimal and 0.025, then use a base year of 100. it is setup like this: 1.025 the 1 represent 100% of the base year, it could be any year CPI index. then to find what the real GDP is just: if the GDP is $16,800,000,000,000 divide by 1.025 $16,800,000,000,000/1.025= $16,390,243,902,439.02 becomes the real GDP estimate adjusted for inflation. The GDP deflator is the: 1.025
To increase real GDP growth output, new products and new business must be financed and export markets targeted. You cant account for all the total dollar values of your GDP from inside the U.S alone, we have to export more, and correct our trade account imbalances to a positive current account balance.
The truth is That US has become a Raw Material Supplying to the true producers,Service oriented consumer driven Economy. Its swimming in things (like back scratching, and tunnels for faster data transmission) that are not worth their weight in gold-or mabe to a few people. The GDP generating middle class has been slowly stripped of all the perks that helped them to be productive in the past. Add to it Destructive Competition that destroys the earning power of the middle level of the proffesions,and you got the 30s all over again. The graph shows that.
It is not the same though because we are not that stupid not to learn from the experience. But we can be duped to fall into the hole again. Every generation has to contain its own con men and women. What happens to the QE3,4,5 etc dollars thou. It end up with the 1% causing inflation in collectibles, mansions, stocks etc. Stocks Fall, Money disapear-Perfect! Ultimately Highly Logical.
While a lot of this site is great, charts like this one are in error. GDP is already discounted for inflation as it is stated in real terms. To divide by a nominal gold price just double counts the inflation discounting.
Also, while I am a big fan of pricing in gold for long assets like stocks, houses and long commodities, it makes no sense for short lived items like pork bellies or annual operating numbers like GDP or minimum wage.
Gold moves not just because next year's estimate of money supply and inflation changes, but it moves by the present value of all future inflation from today all the way to infinity in the future. So, you can only use it to control for inflation by dividing assets by its price if the assets are also long lived.
Thanks for reading Priced in Gold. I appreciate your comments. However WRT the GDP, you are incorrect. My charts use data from the US BEA, which publishes its data both in "current dollars" and "real dollars". Current dollars are dollars at the time of measurement, while "real" dollars are "chained 2009 dollars", adjusted for the price index of 2009. Thus, the current dollar GDP in 1947q1 is reported as 243.1 billion, while the "real" GDP of 1947q1 is reported as 1934.5 billion. Needless to say, I use the current dollar value of GDP to prepare the Priced in Gold chart, so there is no double counting.
I also disagree about gold's price being a discount of all future inflation… Gold is MONEY. It has been money for thousands of years, in thousands of communities around the world. Many other things have been tried, but gold always seems to be the last money standing after these experiments conclude. The value of the dollar varies wildly depending on people's assessment of risks of many sorts, including inflation and liquidity expectations, interest rates, resilience of counter-parties, trustworthiness of the issuing central banks, acceptance by trading partners, etc. I do not attempt to "control for inflation" by pricing in gold. I look at how much gold I would have to give away at any point in time to get another asset, and how much gold I could receive in trade for that asset at some other time. This to me is the best definition of monetary profit, independent of any fiat currency that might be used as in intermediary step of the trading process. From this point of view, pricing wages, pork bellies, coffee, milk, gasoline at the neighborhood pump, and GDP itself (which is just an estimate of the aggregate of many such transactions) in gold all make good sense.
I wander If Russia is sitting on Gold and how much will they be willing to part with to preserve the sovereinghty of their Oligarchycal Capitalism. Russia in trouble US GDP go up according to the Equation $(US GDP)/$(mg GOLD).(No Apples and Oranges Here only supply and demand – assuming World bank gold manipolation as a constant).
LENIN HAS THE LAST LAUGH.
Vladimir Lenin's New Economic Policy in the Soviet Union (1920's). It meant that the Communist Party held monopoly over political power, while retaining control of large enterprises, foreign trade, means of transportation, banks, energy, communications and heavy industry among others. Private ownership was allowed everywhere else, including agriculture and trade.
Well according to P. KRUGMAN (in NYTimes Mon 2-23-15) US Has arrived @ that point.
In my opinion, Through many years of DEMOCRACY-(Probably Thirty-since the actor preident).
China and Russia Have Arived At it Through an evolution(70+years) of pitiless repression.
Fascinating-I Prime directive protocol of non interference has to be followed.
Wander Who is selling gold. The Chineese hoards that were lured into a bubble by their government (sounds familiar – doesn't it). Brokers liquidating their accounts – hmmm.
Russia oil revenue is in the dumpster along with a lot of US oil diggers. Sounds like repeat of the 80's. Yea but Soviet Union is no more, Just Russians sticking together.(No debt though)
Well anyhow this makes US GDP look good. It is otherwise flat. Yearly GDP @ 2%, Inflation around 2%. Guess what? it's zero. with uncertainty of 3% or more its probably negative.Raise the Untouchables (The Big Banks)interest rate from zero in the near future ,chance of zero. This is a zero economy going to zero future growth. Worked for a company like that. The CEO had rap like you would not believe. Took them Ten Years to die. Mr. Sulu get us out of here!!
@Tom: I think it is on the other side – GDP converted from dollars. So actually what is says that dollar purchase power is really low now. Dollar should be able to buy more gold
OK, End of 2015 – Wages Stagnant (Minimum Wage take 20 years to reach $15 Yipee!)
Productivity Falling Along with Industrial Output.
Labor force participation 68% !!!! WHAT t F
FED increasing rate OUT of DESPERATION – to have something to fight the
next Contraction. (Yea .5% is Going to help)
Algos and RoboTraders taking out $100K + capitalization out of Stock Mart
every Day. (Otherwise no Bonuses)( That's what all those R&D Dept's of
the Banks were doiung. I Always Wandered about that. What makes
these clowns pay for themselves).
The Fascinating thing is yhat THERE is any OUTPUT AT ALL! Well I guess we got to Eat. Cars are selling. Keeps the GDP afloat That is all.
La Garde (of IMF)-admire- says "Mediocricity is the new NORMAL". I agree and I refuse to buy Mediocre Crap. I suspect that behind the negative rates is the need to make people(Consumers) to Buy mediocre products (Poorly QC'd) or services. Products and Services are at the heart of GDP. No Buy No Produce, GDP contracts, Bank rates go negative or zero. Recession Ensues, Keynesian remedies don't help. Now who was the other guy? Marx? Been there it sucks. Mr Sulu can we get outa here to warp speed 11?
LaGarde is right – The new Demographic of old people living longer (everything much longer) and stopping to consume everything except medical services (at a loss) will reduce GDP Globally by 0.2%. That is too conservative. I think it will be much worse with US debt instead of unwinding, in the US growing and keeping GDP growth below 3% (with uncertainty of +/- 3% it might well be negative) for the foreseeable future. We are talking stagnation-gold is not moving either. Serfdom for the indebted masses.
@The banker:
A dollar according to constitutional money should be 371.25grains of fine silver (about.8 of an ounce) with gold in a ratio 15 to 1 this changed in i think 1835 to 16 to 1 so 1 ounce of gold should be worth about 20 dollars? according to my calculation.
Im sure that its a coincidence that roosevelt conviscated gold at 20.87$ per oz and then devalued the dollars paid out for the same gold revalueing gold at 35$ per oz in the goverements hands I think thats what you call theft. Just think how much theft is taking place now and who knows what else1200$ oz
No theft, Just making it unatractive to spend your $ for gold. Socialism a'la FDR did not really work well. It took the crash of 1937 and WW2 with about 30 million dead to get US out of the depression. Then with everybody bombed out US bloomed. What a price to pay.
Gold was cut loose in 1971 because US bought the colonial rights to Vietnam in dollars and the FRENCH (Knowing what disaster they sold to the US) were afraid of Dollar loosing value against GOLD. Demanded to exchange all their dollars for GOLD. By decoupling DOLLARS (NIXON) from gold, gold went through the roof and nobody else wanted to exchange Dollars (EURO DOLLARS) for overpriced GOLD and the buck was safe.
Now with production booming all over the world US factories are getting Neutron bombed (ref. the rust belt and the rise of TRUMP). NOW Production has to be carefully managed with inflation about 2% so that people will be forced to spend their depreciating $. And Keep the world plunging into possibly terminal DEPRESSION. Gold is only to BUY (PHYSICAL) and HOLD. But Remember Radioactive GOLD is worthless!!!!
I Miss the Bloggers from the old USA GOLD site. They perfectly detailed the manipulation of gold that went on Between various European CBs and The FED. The Overwhelming decision was to Buy and Hold gold jewelry, Coins etc. Gold is stuck now @ $1200 not sure why? Got something to do with 60 million displaced people world wide – GOT TO BE THAT DEMAND IS STUCK People wont buy gold if they are struggling to survive-and they been cleaned out and depend on GOVERNMENT LARGESS to survive .
GDP 2% going to 4% is a fantasy (The DONALD got a planet to sell-MARS). The trouble is that Purely Financial transactions FEES receipts are being counted as services receipts. WArren BUffet's calculations of an ever increasing per capita $ are based on 2% GDP increase are overly Optimistic. Non Finantial (NON SPECULATIVE) Receipts are actually decreasing (if only for the +_ 3 % uncertainty) The true GDP is more like -2%. Therefore the DISPAIR phenomenon (Pie stopped growing-especially for non-college
This chart correlates very closely to observable reality of the US economy in the relevant time period. Has the editor of this site thought of creating a similar chart measuring in gold China's GDP from 1960 to present? As well as GDP of other countries? — France, Germany, UK, Russia, India, Iran, etc. This could reveal important truths about recent history. Thank you for your valuable work.
@Henq: Thanks for the suggestion! You can see the chart here. It looks very similar to the US Per Capita Disposable Income chart (probably because GDP and Personal income are closely related). Note that unlike PCDI, GDPPC is still below the levels of 1947!
To me, the chart in whatever FIAT currency is just a feint. @editor: your're my man!! Your idea to pegg the GDP to some commensurable "real" commodity (can I call gold a commodity?) is just great. Reveals the reality in a trustable light.
I was feeling, for long time, that the stock exchange charts do not reflect the reality (somebody labeled earlier the "survival mode" of the people, a great enlightment).
The GDP chart do not account for inflation, nor for the ammount of printed money (more than ammount at one moment would be nice to have access to the rate of change of the ammount of money)…
To put it strait: this kind of plot reveals what the value of the dollar (or whatever currency) in reality is.
@Tom: Dear Tom from May 2008, regarding the horse shit this chart was giving you.
Over the next several months, the US will experience:
• The failure of a major investment bank
• A systemic seizure in interbank lending
• Emergency government intervention in both banks and money markets
During this period:
• Industrial commodities will collapse alongside global demand
• US GDP will contract sharply, driven by credit destruction, not gold prices
• Gold will be one of the few assets to recover first, despite forced liquidation
If gold were merely a speculative commodity, it would fall and remain depressed with oil, copper, and equities. It will not.
What is occurring is not commodity inflation — it is the early stage of a monetary crisis, and gold is responding to currency risk, not GDP optics.
Pings on US GDP
Comments on US GDP
Horse crap. Are you claiming that the US outputs half of what it outputted six years ago?
Gold is a commodity, like any other, and is currently in the midst of a speculative bubble, and it is this surge in speculation that has caused the apparent decline in US GDP that your chart displays.
Well its a year + later. And the "bubble" is still in progress.
As for output cut in half… no, it could be even more…!
I agree, I reckon the output is less than half what it was 2003/4.
Hey, nice site you got here! Keep up the excellent job
Great site. Can you please do US GDP in barrels of oil and other commodities? It's so hard to find this kind of information.
Hi Bob. This site has the focus on gold pricing, but the data you need to price in other commodities is freely available. For example, oil prices can be downloaded from http://research.stlouisfed.org, and GDP from http://www.bea.gov. I think you'll find that GDP priced in oil (or silver, or copper) looks quite similar to GDP priced in gold. Good luck!
HOUSTON WE REALY HAVE A PROBLEM! THIS IS A LOSS OF 2/3 OF THE NATIONAL OUTPUT WE ARE – …!
bUT AS MY FRIEND SCHWARTZ SAID THIS TOO SHALL PASS.
3 years later, how's that 'speculative bubble' workin tom?
answer: 6 years left of a secular bull
As goes the GDP so goes the disposable income. IT'S SURVIVAL MODE ONLY!!!!
HOW LONG DID YOU SAY THE BACKUP BATTERIES WILL LAST?
Houston, we can't cut anything.
Cool Chart, really illustrates the hoax that GDP is when put in a commodity its waaaaaay down. Would be nice to see some sort of honest aggregate like oil, wheat, silver, gold, copper etc all together, im sure the curve would be the same in general but a bit softer. You know things are really bad when you can look up US GDP output and see that even in their bogus terms its falling. In real terms its catastrophic.
tom is wrong, i think. It doesn't matter if gold is in a speculative bubble, dollarwise. These comparison charts remove dollars from the equation, purely comparing values as if gold were traded directly for the item in question. The dollar is only used to find current prices, which simply illuminates what the markets are deeming each commodity's worth to be.
I don't see how these numbers can lie. GDP, if accurately reported, is a dependable figure. Gold is a commodity with a price. The fact is, this chart shows the that the price of gold versus the price of the GDP IS THIS. period. Speculative bubble or not, everybody is in agreement with what gold is worth in dollar terms, or its price wouldn't be what it is. it functions at that level.
And is it so outrageous that the US can't produce product at an infinitely expanding rate? Nothing grows forever
I bet Tom is wishing he had invested in the gold "bubble" back in '08….like I did. Our GDP has been inflation driven not growth driven. The government has the incentive to cover that up…. smaller payouts to SSI. Even today they are still saying there is virtually no inflation, welcome to the real world.
Less and less items produced by this country are worth its weight in gold.However, poroduce we must. Ever more dubious means of exchange for ever more dubious goods and services-mostly services these days-keep people off the streets too exhausted to notice a decrease in standard of living(and of wealth) that the plunging curve signifies.
I Know a person that bought a house in Jersey Wycof area in 1950 for 20K 2K down at 2.1% for 30 years. Sounds about right. Disorganized desperate workforce and teabagger cuts spell only one thing DEFLATION.
@ Gromit (and anyone else)
If you want a graph which measures GDP in terms of a more honest aggregate then just find a graph plotting the US Real GDP. Measuring the US economy by the amount of gold it can buy is absurd. Its just a rather complicated way of showing the change in the price of gold relative to the growth of the US economy.
And yes the price of gold has increased a lot relative to everything. This is largely due to it being a focal point for investors in times of uncertainty. It will come crashing down if/when the global economy recovers. The price of gold is very volatile, it has crashed before and will crash again. If you are holding it be ready to jump, but if you don't know that already there's no chance that you'll jump in time: people who are well informed and speculating by investing in gold will be able to sell their gold before you when the market takes a down turn. They will have made a lot by investing in gold, you probably won't have: the lucky people who bought back in 2005 or earlier will probably do no worse than break even. After that who knows.
TRUE, gold is strictly buy and hold (forget). No Day Trading Here!
The only reason Europe did'nt sink yet is because the principal players (Excluding Eastern Europe) are sitting on TozNS of Gold. These guys are not selling any time soon. (Debt Shmebt). We'll monetize it while keeping middle class strugling (paper with immages on it being recognized(marketed) in exchange for survival). Meanwhile in the US – we produce Chevys with front brake pads missing. Produce we Must = survival.
The Question Is What will US standard of living Look Like when Equilibrium is reached, i.e. when US GDP is more valuable tnan gold.HOUSTON, Hope there is no pocyclipse in the equation!
The GDP rises with inflation. There is very little substance in it.
When did the current fall-off start? It looks like it was about 2001-2002. The economy was able to run on fumes for another five years or so, but eventually reality bit us in the you-know-where. It's really surprising that the drop-offs are that sharp.
Yes indeed, The 2% or so FED sponsored inflation showes in the goods and services – mostly services- output of US. The capital markets do not invest in factories or rails or stuff, its all QUants run casino where the probability of trend up or down is the basic reason for investment. This is leveraged to the hilt. 700 Trillion – probably more, we talking Quintilions. This is the reason why JPMChase still makes profit after loosing 10 billion.
These are huge ammounts racing in the algorithms. From what counterparties do they suck up the gains? Looks like Masterbation to me. Houston!, you playin with yourself while we crash?
Captain All I am suggesting is that if you increase your power by 2% and the Thalians Web cavitational vortices increase by 2% you get 0% net movement. Look what happened to Capt. EuroDecker. He Decided to cut power and now He is stuck to the Web and slowly being digested in the trap.
I would suggest to remove the Ferenges from the anti-matter reactor room and do some di-lithium redistribution and increase the warp factor without (this has no meaning to us Vulcans) overflowing the toilets.
Sooo being stuck in a liquidity trap actually stabilizes one's GDP.
The US GDP is dropping at an alarming rate, also in dollars ( not inflated dollars ) John Williams Shadow Government statistics shows it is dropping at around 2% a year, since 2000?
OK, Ben B. opened his mouth and mini crash followed. President O. made references to Ben B. being history on C. Rose (true gem on PBS). Ben B. shut up and coughed up another 100 B. a Month to keep everybody happy. You Don't Have to be a Vulcan to see the logical conclusion to this. Or mabe you have to be a Vulcan.
Am I wrong? or does it bother anyone else that GDP peaks at 1200 billion grams, isn't there under 200 billion grams (unmined) in the world?
There are a lot of ways to slice and dice this one… For starters, the entire concept of GDP is bogus, and of questionable value. You can’t “buy” a country’s GDP; it’s a theoretical summation of all of a country’s transactions. This also implies a velocity component (the money transacted gets used multiple times). GDP is usually “deflated” by a heavily massaged (and thus extremely understated) price index number. For this chart, I have chosen to use the gold price as the deflator instead.
"You can’t “buy” a country’s GDP; it’s a theoretical summation of all of a country’s transactions." That is correct, It is not subject to Supply Demand markets. However massaged, it shows-if massaged according to consistent rules and compared to gold-the relative wealth of a nation. Right now US Goods and Services is 10% Goods and 90% Services.
Sooo what that mean? The Future of US depends on 10% manufacturing and the rest depends on my travel agent calling my tennis coach so together they can open a nail salon. And it shows.
This is a Didn't Shouldn't Question:
Didn't Gold Burst a bubble recently and Shouldn't we be getting a spike in GDP Worth?
Could it be that Gold and GDP went into the toilet at the same time?
I am just pointing out It Could be that US GDP is draging down the price of gold-WOW.
It's good to be in the 0.1 % right now.
@James Best: I hope your right this way I can buy, but the reality is that the last time gold went on a long term downturn, was when volker set interest rates to above 20%. Nowadays The US can't afford anything but 0% interest rates.
One phrase comes to mind – LIQUIDITY TRAP. Uniform misery. Bouncing about The bottom.
The 64 bitcoin Question what to do other than WAR?
It's good to be in the 0.1 % right now.
Kapt'n I am merely stating that the Hollowed Out Economy is swallowing up Huge amounts of stimuli-both "seecret process" Paper(Mentally associated with surviva) lndeeded and the Economy "is really great" media psychobabble for this logically to be anything but a vitual Liquidity Black Hole. Scotty you got some of that Single Malt Klingon Killer, Thats for the human half.
DATA you IDIOT you replace those DI-Lithium crystals with GOLD will spin out of contol into the vortex.
@Tom:
Gold is not in a speculative bubble, and Gold price per ounce surge is not disfavoring the GDP. The federal Reserve is destroying the value of the u.s dollar ever since its founding in 1913. The proper way to value a currency ( not taught in school) is to equate $1 to 1 ounce of gold. if that was the case then we would not be in a recession every now and then. The federal reserve manipulation of the price of money is what is killing the dollars' value and so the Government added to that by over spending, which throw their annual budget out of balance ever from the time their over spending began. Check the figures of the debt increases from WW1 TO WW2 and the Korean war, the Vietnam war, military bases all the world, the Iraqi war of 2003 plus war on terrorism. All these things cost money. The money the government uses is called "borrowed money with a price". The federal reserve is the sole non-government agency that set the price of money for the government bonds and the discount rate for the commercial banks. The fed's ability to print more currency eats away at the purchasing power of previous dollars lent out by them. In so doing creates price inflation which inflates certain assets classes and set the precedence for a rate increase. If the rate keep moving up and down as the fed see fit, then what we will have is the devaluation of the currency overtime.
The surging price of gold per ounce is telling you something about the dollar's value at hand. Investors who know what the fed is doing, is edging themselves against the devaluation of the dollar, the u.s government is also adding to the escalation of a u.s dollar default. International creditors will sooner and later decide to create a run on the dollar and rush to get as many gold bullion as they can to avoid their paper holding from being wiped out. The Gold price is reflecting common sense, while the price is no too high get more of it before it does. The reasons why the U.S GDP output declines is because where the commercial banks chose to allocate credit is in those firms that have invested a part of that money the equities market which as you know have an element of risk. Most of the money is not going to finance new business start ups and manufacturing. With out those two pillars erected and maintain the country will not have the manufacturing facility to be producing more out put. As a result GDP output falls, but prices will keep rising as business try to acquire more revenues through their sales column as a result the GDP will appear as if it is increased. The GDP comes at a cost, that cost goes back to the price of money control by fed. When the lowers the discount rate it is only for a short term , then when the inflation in prices sets in again on the market, they will increase the discount rate incrementally, the fed funds rate is set either.25 basis points or sometimes .50 basis point below the discount rate, the prime loan rates will be set by the individual commercial banks which in turns set the real price of money to the overhaul economy. These rates will reflect themselves in the prices of good & services that quantifies the GDP. If the GDP true output as fallen, it is because of the increase in the cost of loans.
Businesses will cut back on what they can spend, and add that to their bottom line where they can, not in all cases though. The inflation rate must be subtracted from nominal GDP estimated growth rate so we can have the real GDP GROWTH RATE. the inflation rate serves a factor of the GDP Deflator. The inflation rate added together with a CPI INDEX base year.
For example; If inflation rate is 2.5% then convert that to a decimal and 0.025, then use a base year of 100. it is setup like this: 1.025 the 1 represent 100% of the base year, it could be any year CPI index. then to find what the real GDP is just: if the GDP is $16,800,000,000,000 divide by 1.025 $16,800,000,000,000/1.025= $16,390,243,902,439.02 becomes the real GDP estimate adjusted for inflation. The GDP deflator is the: 1.025
To increase real GDP growth output, new products and new business must be financed and export markets targeted. You cant account for all the total dollar values of your GDP from inside the U.S alone, we have to export more, and correct our trade account imbalances to a positive current account balance.
i hope that helps clear things up !
YHWH ALHYM YHWSHA be praised.
The truth is That US has become a Raw Material Supplying to the true producers,Service oriented consumer driven Economy. Its swimming in things (like back scratching, and tunnels for faster data transmission) that are not worth their weight in gold-or mabe to a few people. The GDP generating middle class has been slowly stripped of all the perks that helped them to be productive in the past. Add to it Destructive Competition that destroys the earning power of the middle level of the proffesions,and you got the 30s all over again. The graph shows that.
It is not the same though because we are not that stupid not to learn from the experience. But we can be duped to fall into the hole again. Every generation has to contain its own con men and women. What happens to the QE3,4,5 etc dollars thou. It end up with the 1% causing inflation in collectibles, mansions, stocks etc. Stocks Fall, Money disapear-Perfect! Ultimately Highly Logical.
Hi-
While a lot of this site is great, charts like this one are in error. GDP is already discounted for inflation as it is stated in real terms. To divide by a nominal gold price just double counts the inflation discounting.
Also, while I am a big fan of pricing in gold for long assets like stocks, houses and long commodities, it makes no sense for short lived items like pork bellies or annual operating numbers like GDP or minimum wage.
Gold moves not just because next year's estimate of money supply and inflation changes, but it moves by the present value of all future inflation from today all the way to infinity in the future. So, you can only use it to control for inflation by dividing assets by its price if the assets are also long lived.
@john talbott:
Hi John,
Thanks for reading Priced in Gold. I appreciate your comments. However WRT the GDP, you are incorrect. My charts use data from the US BEA, which publishes its data both in "current dollars" and "real dollars". Current dollars are dollars at the time of measurement, while "real" dollars are "chained 2009 dollars", adjusted for the price index of 2009. Thus, the current dollar GDP in 1947q1 is reported as 243.1 billion, while the "real" GDP of 1947q1 is reported as 1934.5 billion. Needless to say, I use the current dollar value of GDP to prepare the Priced in Gold chart, so there is no double counting.
I also disagree about gold's price being a discount of all future inflation… Gold is MONEY. It has been money for thousands of years, in thousands of communities around the world. Many other things have been tried, but gold always seems to be the last money standing after these experiments conclude. The value of the dollar varies wildly depending on people's assessment of risks of many sorts, including inflation and liquidity expectations, interest rates, resilience of counter-parties, trustworthiness of the issuing central banks, acceptance by trading partners, etc. I do not attempt to "control for inflation" by pricing in gold. I look at how much gold I would have to give away at any point in time to get another asset, and how much gold I could receive in trade for that asset at some other time. This to me is the best definition of monetary profit, independent of any fiat currency that might be used as in intermediary step of the trading process. From this point of view, pricing wages, pork bellies, coffee, milk, gasoline at the neighborhood pump, and GDP itself (which is just an estimate of the aggregate of many such transactions) in gold all make good sense.
I wander If Russia is sitting on Gold and how much will they be willing to part with to preserve the sovereinghty of their Oligarchycal Capitalism. Russia in trouble US GDP go up according to the Equation $(US GDP)/$(mg GOLD).(No Apples and Oranges Here only supply and demand – assuming World bank gold manipolation as a constant).
LENIN HAS THE LAST LAUGH.
Vladimir Lenin's New Economic Policy in the Soviet Union (1920's). It meant that the Communist Party held monopoly over political power, while retaining control of large enterprises, foreign trade, means of transportation, banks, energy, communications and heavy industry among others. Private ownership was allowed everywhere else, including agriculture and trade.
Well according to P. KRUGMAN (in NYTimes Mon 2-23-15) US Has arrived @ that point.
In my opinion, Through many years of DEMOCRACY-(Probably Thirty-since the actor preident).
China and Russia Have Arived At it Through an evolution(70+years) of pitiless repression.
Fascinating-I Prime directive protocol of non interference has to be followed.
Wander Who is selling gold. The Chineese hoards that were lured into a bubble by their government (sounds familiar – doesn't it). Brokers liquidating their accounts – hmmm.
Russia oil revenue is in the dumpster along with a lot of US oil diggers. Sounds like repeat of the 80's. Yea but Soviet Union is no more, Just Russians sticking together.(No debt though)
Well anyhow this makes US GDP look good. It is otherwise flat. Yearly GDP @ 2%, Inflation around 2%. Guess what? it's zero. with uncertainty of 3% or more its probably negative.Raise the Untouchables (The Big Banks)interest rate from zero in the near future ,chance of zero. This is a zero economy going to zero future growth. Worked for a company like that. The CEO had rap like you would not believe. Took them Ten Years to die. Mr. Sulu get us out of here!!
@Tom: I think it is on the other side – GDP converted from dollars. So actually what is says that dollar purchase power is really low now. Dollar should be able to buy more gold
OK, End of 2015 – Wages Stagnant (Minimum Wage take 20 years to reach $15 Yipee!)
Productivity Falling Along with Industrial Output.
Labor force participation 68% !!!! WHAT t F
FED increasing rate OUT of DESPERATION – to have something to fight the
next Contraction. (Yea .5% is Going to help)
Algos and RoboTraders taking out $100K + capitalization out of Stock Mart
every Day. (Otherwise no Bonuses)( That's what all those R&D Dept's of
the Banks were doiung. I Always Wandered about that. What makes
these clowns pay for themselves).
The Fascinating thing is yhat THERE is any OUTPUT AT ALL! Well I guess we got to Eat. Cars are selling. Keeps the GDP afloat That is all.
La Garde (of IMF)-admire- says "Mediocricity is the new NORMAL". I agree and I refuse to buy Mediocre Crap. I suspect that behind the negative rates is the need to make people(Consumers) to Buy mediocre products (Poorly QC'd) or services. Products and Services are at the heart of GDP. No Buy No Produce, GDP contracts, Bank rates go negative or zero. Recession Ensues, Keynesian remedies don't help. Now who was the other guy? Marx? Been there it sucks. Mr Sulu can we get outa here to warp speed 11?
9
I know she meant rates of return,I just gave it a new interpretation.
LaGarde is right – The new Demographic of old people living longer (everything much longer) and stopping to consume everything except medical services (at a loss) will reduce GDP Globally by 0.2%. That is too conservative. I think it will be much worse with US debt instead of unwinding, in the US growing and keeping GDP growth below 3% (with uncertainty of +/- 3% it might well be negative) for the foreseeable future. We are talking stagnation-gold is not moving either. Serfdom for the indebted masses.
Hell, I am Talking TO Myself!
funny that the first comment says gold is in a speculative bubble -> back in 2008 haha
@The banker:
A dollar according to constitutional money should be 371.25grains of fine silver (about.8 of an ounce) with gold in a ratio 15 to 1 this changed in i think 1835 to 16 to 1 so 1 ounce of gold should be worth about 20 dollars? according to my calculation.
Im sure that its a coincidence that roosevelt conviscated gold at 20.87$ per oz and then devalued the dollars paid out for the same gold revalueing gold at 35$ per oz in the goverements hands I think thats what you call theft. Just think how much theft is taking place now and who knows what else1200$ oz
No theft, Just making it unatractive to spend your $ for gold. Socialism a'la FDR did not really work well. It took the crash of 1937 and WW2 with about 30 million dead to get US out of the depression. Then with everybody bombed out US bloomed. What a price to pay.
Gold was cut loose in 1971 because US bought the colonial rights to Vietnam in dollars and the FRENCH (Knowing what disaster they sold to the US) were afraid of Dollar loosing value against GOLD. Demanded to exchange all their dollars for GOLD. By decoupling DOLLARS (NIXON) from gold, gold went through the roof and nobody else wanted to exchange Dollars (EURO DOLLARS) for overpriced GOLD and the buck was safe.
Now with production booming all over the world US factories are getting Neutron bombed (ref. the rust belt and the rise of TRUMP). NOW Production has to be carefully managed with inflation about 2% so that people will be forced to spend their depreciating $. And Keep the world plunging into possibly terminal DEPRESSION. Gold is only to BUY (PHYSICAL) and HOLD. But Remember Radioactive GOLD is worthless!!!!
I Miss the Bloggers from the old USA GOLD site. They perfectly detailed the manipulation of gold that went on Between various European CBs and The FED. The Overwhelming decision was to Buy and Hold gold jewelry, Coins etc. Gold is stuck now @ $1200 not sure why? Got something to do with 60 million displaced people world wide – GOT TO BE THAT DEMAND IS STUCK People wont buy gold if they are struggling to survive-and they been cleaned out and depend on GOVERNMENT LARGESS to survive .
GDP 2% going to 4% is a fantasy (The DONALD got a planet to sell-MARS). The trouble is that Purely Financial transactions FEES receipts are being counted as services receipts. WArren BUffet's calculations of an ever increasing per capita $ are based on 2% GDP increase are overly Optimistic. Non Finantial (NON SPECULATIVE) Receipts are actually decreasing (if only for the +_ 3 % uncertainty) The true GDP is more like -2%. Therefore the DISPAIR phenomenon (Pie stopped growing-especially for non-college
This chart correlates very closely to observable reality of the US economy in the relevant time period. Has the editor of this site thought of creating a similar chart measuring in gold China's GDP from 1960 to present? As well as GDP of other countries? — France, Germany, UK, Russia, India, Iran, etc. This could reveal important truths about recent history. Thank you for your valuable work.
@Silvia: Thanks for the suggestion. I am currently looking at the World Bank's GDP data, and may try to put together something along that line.
Does not GDP grow with population (workforce)?
I’d like to see GDP Per Capita prived in gold.
@Henq: Thanks for the suggestion! You can see the chart here. It looks very similar to the US Per Capita Disposable Income chart (probably because GDP and Personal income are closely related). Note that unlike PCDI, GDPPC is still below the levels of 1947!
To me, the chart in whatever FIAT currency is just a feint. @editor: your're my man!! Your idea to pegg the GDP to some commensurable "real" commodity (can I call gold a commodity?) is just great. Reveals the reality in a trustable light.
I was feeling, for long time, that the stock exchange charts do not reflect the reality (somebody labeled earlier the "survival mode" of the people, a great enlightment).
The GDP chart do not account for inflation, nor for the ammount of printed money (more than ammount at one moment would be nice to have access to the rate of change of the ammount of money)…
To put it strait: this kind of plot reveals what the value of the dollar (or whatever currency) in reality is.
@Tom: famous last words….
@Tom: Dear Tom from May 2008, regarding the horse shit this chart was giving you.
Over the next several months, the US will experience:
• The failure of a major investment bank
• A systemic seizure in interbank lending
• Emergency government intervention in both banks and money markets
During this period:
• Industrial commodities will collapse alongside global demand
• US GDP will contract sharply, driven by credit destruction, not gold prices
• Gold will be one of the few assets to recover first, despite forced liquidation
If gold were merely a speculative commodity, it would fall and remain depressed with oil, copper, and equities. It will not.
What is occurring is not commodity inflation — it is the early stage of a monetary crisis, and gold is responding to currency risk, not GDP optics.
You welcome ?
Please update this graph
Thanks for the reminder. Chart updated!