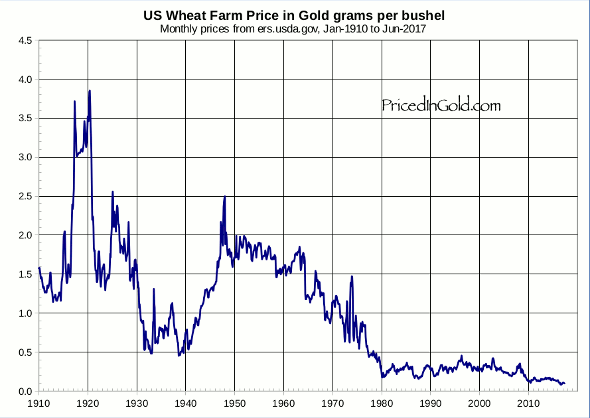
It is interesting to note that US farm prices for wheat are now at their lowest levels since the USDA began keeping records in 1908. Prices are about 1/4 of what they were in the Great Depression from 1931-1933, about 1/10th what they were in the 1950s, and less than 1/30th of their all time highs, set in 1919.
US Wheat, monthly farm prices, in gold grams per bushel, since 1910:
US Wheat, farm prices, in gold grams per bushel, monthly since 1980:

US Wheat closeup, 2005 to present:

Pings on Wheat
Comments on Wheat
This service is by far the most interestng investment tool that i have seen for a long time and beats all these fairy tales I am receiving every day,those self praising cv's published by all these so called analysts who should be hired by the largest investment groups of this world if half what they pretend to achieve would be real.The way the dollar is being managed could only be conducive to a monetary crisis of colossal proportions(hence gold will regain its role of being the only general yardstick)and currencies well covered by real assets(gold for ex or mineral ressources)will be able to protect their holders more than production or employement biased statistics.Great tool you are publishing J.A.Cramer P.S.please extend your charts to ex USA ASSETS,CURRENCIES AND economics figures.Thank you.
The wheat chart is gone! There is no image.
Sorry, Dewaine. The charting service providing several of the site's charts, including wheat, has undergone changes and I will be working to get those charts back online soon. Thanks for your patience.
Charles
What a great site! Your friends at Agora put me on to it.
A couple of comments. Crude Oil is the most traded commodity in the world. You have that one charted, but you are missing #2. That is coffee. I cannot help you with the data for coffee but it should be findable. I am in the rubber business and I send the price of rubber on the first day of January every year to my customers. Sorry I do not keep records on a more frequent basis. Rubber has to be in the top ten most traded commodities and you might be able to find prices for either of these benchmark grades on a monthly basis RSS3, TSR 20, going back some years.
regards Ian
one thing that effects ALL of these charts would be data on the actual gold supply. I'm guessing the aggregate storehouse of worldwide gold must be pretty darn constant though, despite current mining?
The Old Testament states that in 600 BC, during the rein of King Nebuchadnezzar, a loaf of bread was worth 350 loafs of bread to one ounce of gold– a loaf just under one kilo size, not our reduced size loaf of today.
I use this as a good measure of what I can buy with an ounce and it still roughly holds true today!
Hi,
I have been renting out my farmland for several years, but am planning on sowing fall wheat into the soybean stubble myself this fall, and the seeding out the wheat stubble
to hay and letting it sit for thje Sabbath year.
I wondered what you think about the price of wheat for 2014?
Thanks and be blessed,
Peter
I have been researching prices because of scripture I read in Leviticus 27.16 AKJV, as well as other scripture which links precious metals to price. A few facts: ancient Rome, Greece, and even 1400s England had a price in gold per unit of wheat nearly the same. This is around 2.3 grams of per-manipulated silver/ liter of wheat or about .522 grams of gold per bushel (if I did my math right). However prices rose slowly for the next hundreds of years in Europe and America (I do not know about elsewhere), to around three times that cost to around 1.5 grams of gold per bushel of wheat, averaging the prices of the 1700s, and 1800s. I also realized that currency manipulation of a variety of sorts occurred for hundreds of years prior to the post 1913 debacle. The earlier manipulations were not as severe or wide spread, but did exist. Now average prices 1980 till 2017 are roughly back to price in gold per unit of wheat about the same as ancient times. Has anyone else noticed this? Can someone check my math if I messed up some calculation?
If you do the math from pre-manipulated silver into grams of silver/liter or gold/bushel of wheat the following may be helpful:
http://commodityhq.com/education/a-brief-2000-year-history-of-silver-prices/
http://www.nuff.ox.ac.uk/users/allen/studer/amsterdam.xls
https://projects.exeter.ac.uk/RDavies/arian/amser/chrono7.html
Hello. I am wondering if the following is true: Gold leads other commodities in price.
In other words as gold moves "up", or priced in gold, the dollar/fill-in-the-blank-fiat-currency moves down, then about a year later commodities follow.
Here is where I got the idea,
http://www.mcoscillator.com/learning_center/weekly_chart/the_gold_wheat_ratio/
which shows an inverse of wheat priced in gold, but basically it is the same ratio. But the interesting thing to me is the way a year offset chart of gold follows wheat. Maybe this is standard knowledge among many gold bugs, but I never heard of it before. If this is true, then this is sort of a financial tsunami warning system, which could be quite helpful. I am not an paper investor, so it seems a logical question would be, could this help investing in commodities? If so, what practical investing skill/tools/platform/whatever would one learn to take advantage of this, assuming this year lead thing is true.
Wheat is definitely a good one but I wish you also had corn.
The world produces a lot more corn and corn is used for a ton of things
from food to animal food to soda to fuel.
Hi John, I will take a look and see what I can do. Thanks for the suggestion!
Sir Charles.
I greatly appreciate your information on Priced in Gold. I was wondering if you could update the Wheat prices since it looks like the data on the wheat charts ended sometime in 2017. Secondly, would it be considered copyright infringement if I used your charts to copy and share with other people; I am currently in the process of starting a financial newsletter and would add the link to 'priced in gold' in the newsletter. I am willing to pay for any of the charts that are made available on the free portion of the website, if that is what it takes. Thank you.