S&P just released the latest numbers for the Case-Shiller home price database, bringing the series up to September, 2012. Priced in US Dollars, the ten city composite known as CSXR has been rising steadily for all of 2012, and rose again in September from August's 155.18 to 155.63. This means that in those ten cities, used house prices in USD, as tracked by index, were about 56% higher in Sep-2012 than they were in Jan-2000.
When priced in gold, the index fell from 28.17 in August to 26.71 in September, a 5.2% drop. This leaves the index about 10% above its recent low of 24.30, set one year before in Sep-2011. Compared to the benchmark 100 index of Jan-2000, home prices in gold are down 73%.

The big question is, does this represent a bottom for the housing market? These recent values are lower than any historical values going back to 1987, when the index was first constructed. But we have longer data series as well. Let's see what they show us.
First, there is the median sales price of new homes sold in the US, published by the US Census Bureau, which goes back to 1963, and gives us prices up to Oct-2012. The median new home price is currently about 4.1 kg. Its all time low, set back in 1980, is just under 3 kg. This suggests that new home prices may have about 25% further to fall.

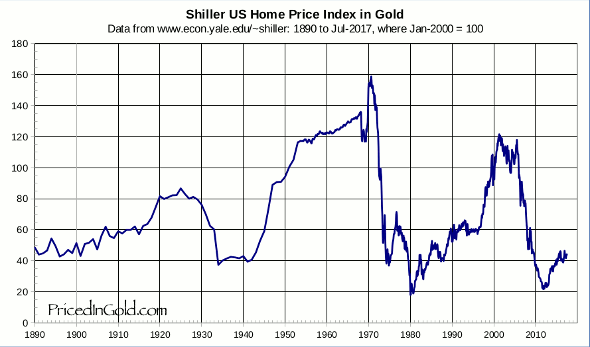
Going even deeper in the past, Shiller has also attempted to construct a National Home Price Index that extends the S&P's Case-Shiller series back to 1890. This quarterly index sits at 23.49 for Q3-2012. Its all time low was 20.06 in Q1-1980, putting the current level about 17.5% higher.
Of course, there is no reason prices have to retest their old lows… but it happens more often than not. If it does occur, it could happen in several ways: through a drop in nominal USD prices, or through a reduction in USD value – also known as a rise in the gold price. Most likely, it will be a combination of these.
The old lows may offer support, but that support may fail, as it did in the last half of the 1970s – leaving prices to find a new bottom deep in uncharted territory. And even if support does hold, prices may pop quickly, as they did in 1981, or it may take years of "base building" at the support level before a new bull market emerges, as it did in the 1930s and early 1940s.
Real estate values also vary dramatically from place to place, so some may have already bottomed when others are still falling. Internationally, there are markets that are currently much closer to their highs than to their old lows.
If you are a very long term investor, with a time horizon measured in decades, it might be time to start looking for select situations and building a portfolio of choice properties. But be patient, and expect that there could be further declines in home prices as measured in gold. Use these declines to add to your collection. I think that over the long term, you will be well rewarded.
Also take a look the charts of farm, timber and commercial property prices. Of these, farmland seems the most robust, and I would certainly consider adding it to your shopping list.


