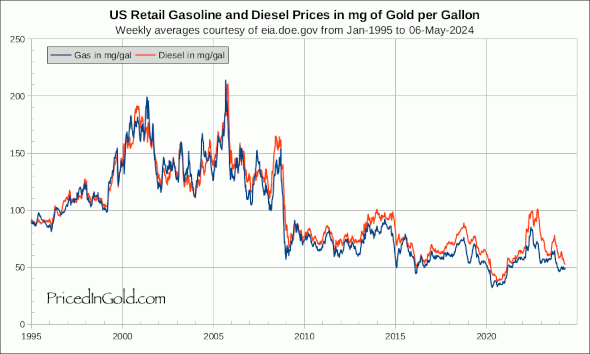
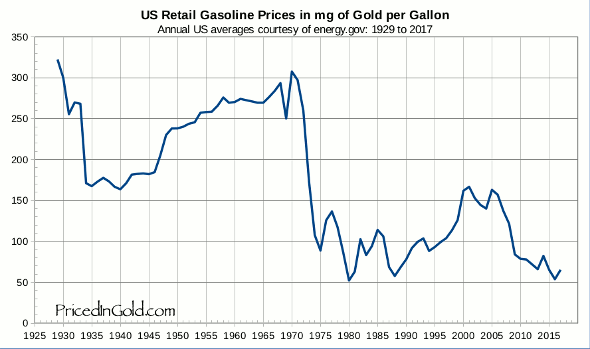
These charts show the retail price of gasoline in the US, given as mg of gold per gallon of gas. They are based on an average price for regular gas in all areas of the country, sampled weekly by the Energy Information Administration.
Prices for gasoline were fairly stable from 1990 to 1999, oscillating around 100 mg/gal. From 2000 to 2008, they became more volatile, varying from 100 to 200 mg, and averaging about 140 mg. In late 2008, as the economy collapsed, gas prices fell to a new low of 57 mg, and have since fallen to about 50 mg today – the lowest seen since 1929. Yet over the time period covered by these charts, the dollar price of gas has gone from under $0.10 per gallon to around $4.00 per gallon, and currently sits at about $2.00 per gallon.
As a child, I often saw gasoline for 25 cents per gallon – in the days when that meant a silver quarter. The melt value of that quarter today is almost $6, another way of pointing out that today's fuel prices, rather than being high, are in fact near their historic lows!
More than 2 decades of weekly US retail gasoline and diesel prices:
click on the chart to download a pdf
Pings on US Retail Gasoline
Comments on US Retail Gasoline
You should also check in terms of EUR and GBP.
If you're a drudge fan: drudgetracker.com
"Rather than complaining about high fuel prices, you should realize that fuel prices are near their historic lows!"
…except, of course, that wages are also in their historic lows 🙂
@curtis: So really the quote could say: "Rather than complaining about high fuel prices, complain about low wages"
Gas is very cheap. With Gas @ Pre Nixon(Gold backed dollar) prices @ $0.20 a Gallon to Debauched Dollar $0.12 per Gallon. The problem is that the 99% got the frog soup treatment(increasing the temperature in the pot gradually) and now they are Cooked.Can't even afford $0.12 gas.
So, if gas prices were – as of the latest chart update – near historic lows in gold-terms, the outlook for $5.00 gallon gas by summer could, irrespective of the decline in U.S. consumption, prove to be conservative (?)
I can't immagine paying $5.00 even in debauched dollars – $0.15 in pre Nix currency. Right now $4.00 per Gal it makes sense for me to consider to get on my bike and pedal 20 blocks to my Chevy Volt parked by the charging station. Situation being – Ossified (possibly confliucted) Con Edison Management draging its feet in installing charging stations on residential streets. Ain't that cooked yet. Remember 16 Kw battery is 40 miles of fun or work or Etc. Then you run the gas engine just for nostalgia.
This is exactly right; the crux is that the Federal Reserve doubled the money supply to "try an bring us out of a recession." The problem is not the high price of gas; it is the low value of the dollar
I Think Debauched Dollars are one part of the blind men's description of the gas prices Elephant.
Another are Planet Saudi Arabia is BSing about its pumping proves. And G. Sucks an Morgan Sucks are colluding (or at least enabling) Russians ( The oil is their major reason for growth) and Oil Companies (Half of British Retiries depend on BP's payouts) to ride World's growing dependency on what is a finite resource. Go electric. There definitelly are no wires between Middle East and US. The utilities are regulated and electricity is definitelly not a finite resource.
In an inelastic demand situation, (which oil is for the most part), oil price reflects the purchasing power of the dollar, with some allowance for speculation…about 1%. In terms of gold, the price is very low right now. Count on motorized bikes being the chief source of mobility before 2014. Just look at Asia and their modes of transportation. If you own a big gas guzzler, I would dump it now before it is very worthless. As I see it, if your transportation does not get 30+ MPG right now your toast, rich, or careless. You also might need some steel to armor the sides so the Indians don't shoot you as you rush to grandmothers house. It's going to get rougher out there.
Seems that price of gold is stuck lately. Could it be that oil is sucking all available $ (It is priced in $) out of everybody. Boy, G./Morgan/ Russia/ M.East / OilCo's are cleaning up. The Average Sheeples capitalistic response should be buying oil futures. Did any body figure out how many options to buy to pay for Gases $1 increase @ the pump. This should be published by the Gomnt as a service to the hooked sheeple. Not a recomendation but you read it here first.
GO ELECTRIC.
I there an Electric Rates vs Gold Chart? That's Average US Electric rates.
This chart needs to go back to at least the gasoline shortage of the early 1970s, and preferably back even further to before the founding of OPEC.
I decided to use my bicycle for everything, even trips to BJ's (Think it stands for Billy Jean probably.) to see what my gasoline consumption was. MY GAS CREDIT CARD FOR JUNE WAS A BIG FAT $0.- (Added a gas presservative to my car gas tank so that the gas would not go bad should an emergency arise and I needed four wheels in a hurry). Imagine the posasibilities – YOU, ME WE ARE PARTNERS!
FOR JULY ALSO a $0.-
AUGUST A BIG FAT $0.-
I just saw a Volvo (that's classy European fronting for the Chinese) electric on the GW Bridge. That's exactly the car for moneyed Profs. Now put that metalic deep red on it, Yea.
On a different note.Looks like the price of gas is in step with the price of gold. Mabe a new gas standard?
You WILL sell your gold to buy gas to get to work to put food on the table so you dont die off and make the gold worthless. Scotty! You got some of that single malt Klingon killer brew left?
Dollar is in the toilet no doubt about it. Things that cannot be cheapened by "Destructive Competition" (The term used from J.P.Morgan himself) are begining to be out of reach of US Sheeple. In Robust economy gas would be $8 or $9.- For People going bankrupt gas becomes a something to scrimp on depresing demand and even forcing Oil Oligarchs to go down in price in real terms. HealthCare, Education, Government Services pensions anything that cannot be Destructivelly Bid on by US or Foreign Pirates Feels like a shakedown.
Scotty! I am not outsoursing my di-lithium crystals maintenance to the Ferenges.
!@#$$
Sept gas bill 0.
It seems like Gasiline is ending to 100$/grams of Gold.
Oct12-Jun13 gas bill $40.- That includes $10.- for "bad" gas from a guy that had 10,000gal of it. My Luck I had to pull up to the pump nobody was using. All I got was a shitty grin from the gas station operator. Hence I don't fill up anymore. Put in 5gal at a time max.
This is very unexpected but very logical-Chinese drilling off of Vietnamese coast. The South China Sea is a marginal sea that is part of the Pacific Ocean, encompassing an area from the Singapore and Malacca Straits to the Strait of Taiwan of around 3,500,000 square kilometres (1,400,000 sq mi). The area's importance largely results from one-third of the world's shipping transiting through its waters, and that it is believed to hold huge oil and gas reserves beneath its seabed. Imagine that the "Gulf" right off of Vietnam. Somebody's country could be very very rich if they had the right friends to defend their teritory. Hmmmm.
@FASCINATING:
And where does the energy for the electricity come from? The big costs of electricity are from fuel and Kapital costs of the equipment. No marketing costs needed.
Solar, Wind, Gas, Nuclear-OUCH, Cap costs can be writen off – provided the right legislation is enacted and individuals are treated as corporations. Lets get rid of the stupid distribution network-well what is practical and not needed to pay when the turn the meter back. Enough people will run the meter back the centralized cash cows will do it themselves-"I guarantee". We need a good methane fuel cell and a bank of caps -(to handle surges) in the kitchen – package (comes with a new house) 67% efficiency " I guarantee". Now Let's see New House, New Gas Pipe Net (Storm, Hurricane, Flood Proof) average house+electric car =20KW service.
Probably could get by on 15KW. And, yea, Spock-keep the Ferenges out of this.
Don't you just love it when US tries to punish Putin with low oil (gas) prices and the Saudis are obliged to go along!
Soviet Union went the way of the DODO but come to think of it TEXAS tanked too. That was a pure Saudi Play though and Sadam was still our friend. Captn I just had a Logical progression to the future This shale will drip dry we'll need more di-Lithium crystals.
Gasoline is hitting a tripple bottom – together with global "secular stagnation" as per P. Krugman is not good,is not good, is not good. Limies(Brits) are cutting themselves free of the "dead man" – Europe. The poor are the first to suffer in a bad economic arrangement – and they know it. Never thought that Eastern Europe could bring down whole Europe while it's pulling itself out of a toilet. My guess is that European Economic Equilibrium Lies somewhere between Prosperous Western Europe and Economically ravaged( corruption and post Soviet dregs, with NeoLib race to the bottom) Eastern Europe and the rim countries. Yea, time to send a probe to Jupiter Captain.
Wow, Top driving Season and the gas price drops! In 1968 $ its @todays price 2.60 x 5%= approx $0.10/gal. I reemember 13gal fillup in my Opel Kadett in 1968 for $3.75 including tax and a free can of Coke. Wow!
The best car I ever had though, was a 2 liter VW BUG CABRIOLET.
It could go all day 75 mph on L.I. Expressway without breathing hard. Essentially a homely sister to a Porche Cabrio (Insurance was cheaper). $3.75 for a fillup – and a can of Coke.