Ever wonder how a stock or an index like the Dow Jones Industrials is doing at the moment, priced in gold? Is it up or down from yesterday? How much?
To do this the "old school" way, you would collect four numbers: the price of gold and the price of the security at the previous trading day's close, and their current prices, all in the same currency. Calculate the previous closing price of the currency unit (USD, GBP, JPY, EUR, etc.) by dividing 31.1035 by the gold price, giving the value of the currency unit in gold grams. Do the same with the current price of gold. Then multiply the prior closing price of the security by the prior closing value of the currency to get the previous gold price of the security. Multiply the current price of the security by the current value of the currency to get the current gold price of the security. Now subtract the security's prior close from its current price to get the gain or loss in gold grams. Divide this value by the gold price of the security for the previous day to see the percentage gain or loss.
Simple, right? Well, it actually isn't too bad once you've created a spreadsheet with the formulas in it… But what if you just want to peek at the prices, and don't have a laptop with Excel handy?
Any financial web site can give you a list of stocks with percentage changes… even from a cell phone browser. For example, the iPhone has a built-in widget that can do just this. You can use this to give an almost instant "reading" on a security's gold price action.
The proper formula for calculating percentage change in the gold price from percentage change in the currency price of gold (Pg) and percentage change of the currency price of a security (Ps) is:
( (Ps+1) / (Pg+1) ) – 1
For example, if gold is up 1.5% in USD and the Dow is up 2.0% in USD, then 1.02/1.015 = 1.004926, and the Dow is up 0.4926% when priced in gold.
But what if even that is too much work – or you don't have a calculator handy?
You can get a close approximation by just subtracting the gold change from the security change.
It is no accident that this figure is really close to what you get by dividing the percentages… for small values of Pg and Ps this will create only a tiny error. Even if the Dow were to fall 10% while gold rose 10%, the true gold price of the Dow would fall by (0.9 / 1.1) = 0.8182 – 1 = -0.1818, or an 18.2% drop. The "back of the envelope" method would suggest a 20% fall = pretty close for such a large percentage swing.
How to get the gold price? Tracking a gold ETF (such as GLD) is one easy way. It moves in lock step with gold by design. Let's take a look at my iPhone for some real world examples:
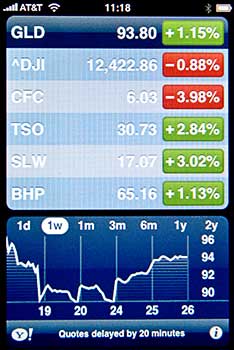
We can see right off that the Dow Industrials (^DJI) and Countrywide (CFC) are doing a lot worse than their USD prices would suggest – in addition to being worth fewer dollars, the value of those dollars has fallen as well! Tesoro (TES) and Silver Wheaton (SLW) are rising faster than the dollar is depreciating, so they are up in gold value, though not as much as their USD prices would make you think. And although BHP Billiton shares are worth more US dollars today than they were yesterday, the fall in value of the USD has more than wiped out the stock's apparent gain. Here are the actual numbers, by proper calculation and by the "back of the envelope" estimation method:
| Symbol |
Actual |
Estimate |
| ^DJI |
-2.01% |
-2.03% |
| CFC |
-5.07% |
-5.13% |
| TSO |
+1.67% |
+1.69% |
| SLW |
+1.85% |
+1.87% |
| BHP |
-0.02% |
-0.02% |
You can see that the values are very close.
You can also use this trick over any time period, as long as the percentage changes are both measured over the same time period. For instance, a news article may state that crude oil is up 14.2% for the year so far. Later in the article it may mention that gold has risen 13.2% YTD. This immediately tells you the true rise in oil prices is around 1% (if you do the full calculation, the actual change is about 0.88%).
So the next time you need a quick check on the gold value of a stock, commodity, currency or index, just subtract the percentage change of gold from the percentage change in your security of interest. You'll have good estimate of the change priced in gold.
Let me know if you have questions about this by leaving a comment, dropping me an email, or by calling the toll-free hotline at 888-868-5656.