This was a rough week for cryptocurrencies, a good week for bonds, and a mixed week for other asset classes. Ethereum took the biggest beating, falling 16.8% to close at 14.3 grams. Bitcoin also fell hard, giving up 10.0%. Strongest was the Nikkei index, which rose 2.6%, closely followed by 20+ year treasury bonds, which gained 2.4%.
The Canadian Dollar was the only falling currency, dropping 1.2%. The Japanese Yen rose the most, gaining 1.6%. Short term bonds and USD cash each added 0.8% while the long term TLT rose 2.4%.
Stocks were strongest outside the US, with the Japanese Nikkei rising 2.6%, while the Dow Jones Industrials fell 0.7%. Gold stocks fell 0.2%, approaching their long-term support level of 4 grams.
Energy and metals were higher this week, led by crude oil, up 1.3%, and palladium, up 1.1%. Cotton fell 1.2% while coffee dropped 1.0%. Silver rose 0.7% and copper was little changed, up 0.1%.
More on the Crypto Crash below.

Click for PDF version
Crypto Crash?
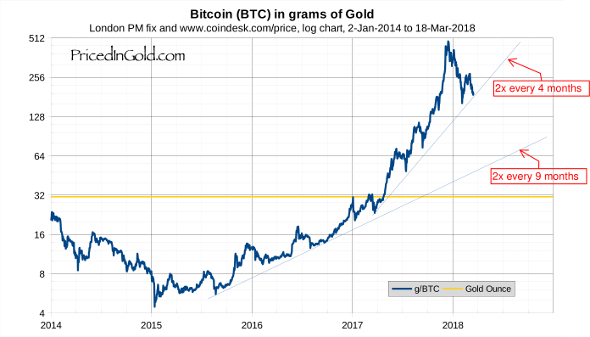
In spite of the recent drop in Bitcoin (and other cryptocurrency) prices, Bitcoin remains in a strong uptrend. Three months ago, Bitcoin was trading at an all-time high of 483 grams. By the beginning of March, its price stood at 260 grams, down 46%. This week it closed at 198 grams, off 59% from the peak. There is no shortage of explanations for the drop, including various government announcements ranging from new regulations to outright bans, massive sales by various actors including the Mt. Gox bankruptcy administrator, and negative pronouncements by leading investors including Warren Buffet and Jamie Dimon.
But in spite of all this hoopla, it is useful to stand back and look at the bigger picture. Although down 16% in the last month, Bitcoin is still up 559% over the last year! And take a close look at the chart below, which is updated weekly on the Bitcoin page. This is a log chart. That means that a rising straight line on this chart represents compound growth. I've drawn two uptrend lines, one starting in mid-2015, showing that Bitcoin's price has been more than doubling every 9 months since then. The second line shows that the price has been more than doubling every 4 months since early 2017. And neither of these powerful uptrends has been violated by Bitcoin's recent volatility.
Of course, these trends will not continue indefinitely. Eventually, they will slow or even reverse. When everyone has the coins they need and want, prices will stabilize at some point. But I think we are still very early in the crypto game. As adoption spreads from the current tens of millions of users to billions of users through networked sharing, this pattern of exponential value growth could continue for quite some time.
If the 4 month doubling trend continues, we can forecast 1 BTC buying 1 kg of gold in early 2019. On the other hand, Bitcoin could rapidly fall from the current 200 gram level to about 50 grams without violating the 9 month doubling trend. At that rate, we could see 1 BTC buying 1 kg of gold before mid-2021.
I don't see Bitcoin, or any cryptocurrency, replacing gold – though they may provide new ways to move gold value around the world quickly and easily. But as a counterparty-risk-free speculation, I recommend a small position to grow your portfolio's gold value. Buy the dips, but don't allocate more capital than you can comfortably afford to lose.