0

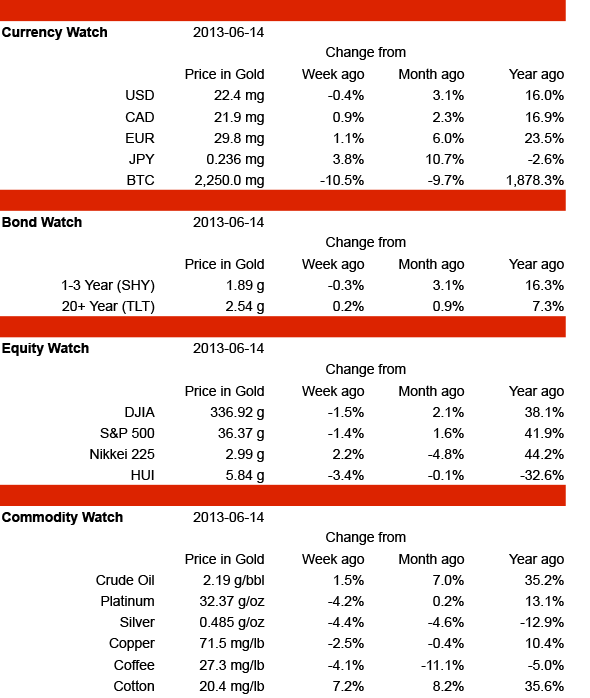
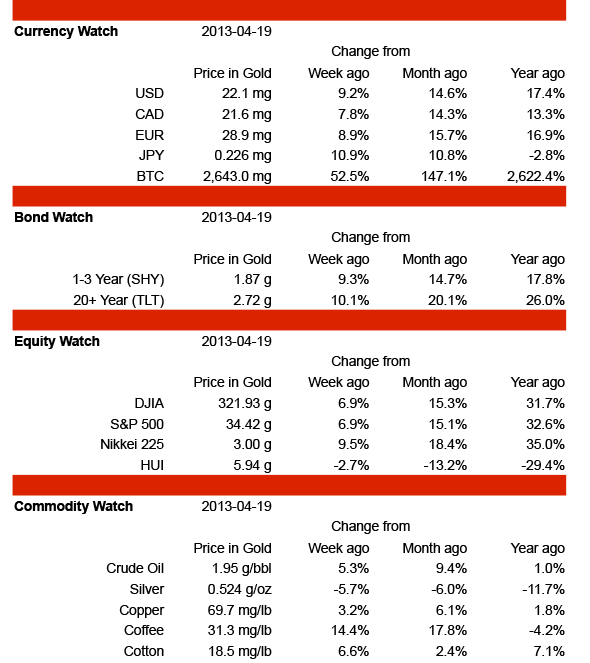
All asset classes but oil, silver, and mining stocks were higher this week. 

Bitcoin ended the week up 57.6% at 2,724 mg, after setting another record high almost every day for the last 2 weeks. Interest in the online currency has continued to skyrocket as news spread that the "bail-in" plan that seized up to 80% of large bank deposits in Cyprus has been approved for future use in the US and Canada as well as in the rest of Europe. After this tremendous run-up, a pullback is to be expected. Note that BTC could fall over 80% to 500 mg or so and still be in an exponential uptrend! Expect further volatility.

The government-issued currencies were also higher, led by the EUR which rose 2.3%. The weakest was the JPY, which gained 1.2%. Bold moves to inflate the Japanese money supply were announced at the end of the week; it will be interesting to see how the markets deal with this news. In trading over the weekend, the Yen has already fallen from 209.3 µg to 202.5 µg.

Bonds where also higher, with the short term SHY gaining 1.9% (in line with the USD, as usual), while the long term TLT gained 6.3% to close at 2.44 g. Technically, this puts TLT back above its resistance line; if this holds as support, we may be in the early phases of a new rally in bonds. Keep an eye on this for the coming week.

Stocks were all higher except for the HUI gold miners, which hit a new 12-year low of 6.38 g on Wednesday before recovering to close the week at 6.51 g, down 6.4%. While I would be a buyer of quality gold stocks at these levels, keep in mind that the HUI is still 55% higher than its all-time low of 4.2 g set back in November of 2000. Make volatility your friend by selling put options and buying on the dips.

In the other stock markets, the Nikkei 225 was the biggest winner, adding 4.8% to close the week at 2.69 g. The Dow gained 1.8% while the S&P 500 advanced 0.9%.

Commodities were mixed with coffee the biggest gainer, rising 4.1%. Cotton and copper were little changed for the week. Silver fell 4.1% and crude oil declined 2.9%, while platinum dropped 1% to close the week 2.4% below parity with gold.

The USD gained 1.9% to close at 19.8 mg. For the last three days of the week it has been more than 20% above its half-life curve. In 2005 and 2008 this level proved unsustainable, and marked the perfect opportunity to sell dollars (and stocks and bonds) and buy gold, mining stocks and other hard assets with an eye to taking profits in about a year. All the pieces are now in place to make this strategy a winner once again!

Table of prices in gold for week ending 5-Apr-2013

Filed under monetary universe by  #

0

All but three asset classes were lower this week, the gainers being Bitcoin, gold stocks, and long dated treasuries

Bitcoin ended the week up 51.8% at 1,392 mg, after setting another record high every day this week. The latest round of panic buying seems to have been triggered by the partial bank account confiscation plan announced in Cyprus. The realization that their money is no longer safe in banks has spooked investors across Europe, but especially in Spain, where downloads of Bitcoin software have skyrocketed. Because Bitcoin has such a small market cap, currently about 15,800 kg, and trades less than 200 kg each day, it doesn't take much money moving in (or out) to swing the price, so we should expect continued volatility in the near future.

The government-issued currencies were all lower, led by the Euro, which fell 1.1% to close at 25 mg. The Japanese Yen was down just 0.1%, while the USD dropped 0.8% to 19.3 mg, and is now 16.6% above its half-life curve.

Short term bonds (SHY) fell 0.8%, in line with USD cash.  Long bonds (TLT) rose 0.6% to close at 2.27 g.

Stocks were mostly lower, led by the Nikkei Index, which fell 1.9% while the S&P 500 dropped 1% to close the week at 30.12 g. The Gold Bugs Index was the only stock index to rise this week, adding 1.4% to close at 6.96 g. Could the bottom be in for gold stocks? We will see what unfolds next week, but I would be a buyer at these levels, especially given the over-bought condition of the USD.

Commodities were all lower. Cotton fell 6.4% to close at 16.9 mg/lb. Copper declined 2%, and  Coffee dropped 1.6% to finish at 26.2 mg/lb. Crude oil also lost ground, falling 0.5%. Silver lost 0.2% while Platinum fell 1.6% to close at 30.57 g, now 1.7% below gold parity.

This week FinCEN, the Financial Crimes Enforcement Network, issued "guidance" about how the US "Bank Secrecy Act" applies to "persons creating, obtaining, distributing, exchanging, accepting, or transmitting virtual currencies". For a good discussion, take a look at the comments of the Bitcoin Foundation's legal counsel. In short, this is a trial balloon that needs to carefully monitored to see what elements will actually be implemented in law in the future. As a recent Forbes article notes:

“It’s almost a badge of respect when the Treasury starts regulating you,” said James Rickards, author of Currency Wars. “You must be doing something right.”

“Gold is a great way to preserve wealth, but it is hard to move around,” added Rickards. “You do need some kind of alternative and Bitcoin fits the bill. I’m not surprised to see that happening.”

And in related news, Jeff Berwick of The Dollar Vigilante announced the formation of Bitcoin ATM, a plan to provide ATMs for anonymous purchase and sale of bitcoins. Target location for the first machine? Cyprus! Maybe they can get together with Gold to Go to dispense gold ingots as well!

Table of prices in gold for week ending 22-Mar-2013

0

Most assets were lower this week, with the major exceptions being Bitcoin, the free market online currency, and Cotton

Bitcoin ended the week up 8% at 917 mg, after recording another all-time high of 938 mg on Monday. Things got exciting the next day, as high transaction volumes caused two different versions of the Bitcoin mining software to update the distributed ledger (known as the "block chain") differently. This split, or "fork in the block chain", was deftly handled by the developer group, but it caused a dip in the price which has now been mostly erased. If you are interested in more technical details, you read about them here. This should serve as a reminder that Bitcoin is a young currency, and still vulnerable to failures of technical, social, or political origin.  Keep position sizes small enough that you won't be badly hurt if one them turns out to be fatal, but keep in mind that there is still tremendous upside if this experiment in free market money succeeds.

The government-issued currencies were all lower, led by the Japanese Yen, which fell 2.8% to close at 0.203 mg. The Euro was down 1.4%, and the USD dropped 0.9% to 19.5 mg, and is now 17.1% above its half-life curve.

Short term bonds (SHY) fell 0.8%, in line with USD cash.  Long bonds (TLT) were unchanged for the week.

Stocks were slightly lower across the board, led by the Nikkei Index, which fell 0.6% while the S&P 500 and the Gold Bugs Index each lost 0.3%. The Dow Jones Industrials were little changed, down 0.1%.

Commodities were mixed. Cotton rose another 5.6% to close at 18 mg/lb. Crude oil also gained ground, rising 0.8%. This week's big loser was Coffee, which dropped 5.6% to close at 26.6 mg/lb. Silver lost 0.4%. Platinum lost 0.6%, erasing the previous week's gain, to close at 31.06 g, now 0.2% below gold parity.

Table of prices in gold for week ending 15-Mar-2013

1

Many people are rightly concerned that the US Federal debt has been exploding in the last few years. A quick look at the following chart will show why:

This chart doesn't try to show all the debts of the United States, just the publicly acknowledged debt of the federal government. So it doesn't include state and local debt, and it also omits unfunded liabilities (promises to pay in the future for things like medicare and social security). This is the number that grows each year by the size of that year's deficit.

As you can see, it stayed pretty small until the 1940s, when World War II moved spending up to a new level. Even then, it didn't rise dramatically until the 1970s, when the US dropped the last vestiges of the gold standard, and began running the printing presses in earnest to fund social programs at home, and the Cold War abroad.

Despite the collapse of the Soviet Union, social and military spending continued to grow in the 1980s and 1990s, paid for with borrowed money. After the market crash in 2001, new programs to "stimulate" the economy were implemented, shooting debt levels to heights never imagined before. And after the 2008 crash, efforts to "stimulate" were redoubled, piling on debt at an even faster rate.

The last few years of this chart are estimates based on the government's own forecasts of future deficits. If history is any guide, these will probably turn out to be on the low side.

Of course these debts are financed primarily by the Federal Reserve buying the government's bonds with money that it creates out of thin air. This process has many pernicious effects, distorting interest rates, inflating the money supply, distorting perceptions of risk, and causing businesses and consumers to misallocate their resources.

Although we are focused here on the United States, this same process is going on, with various twists, in all the major economies, including Japan, Europe, the UK and China. So these distortions are worldwide in scope, and undermine the value of all of the government issued "fiat" currencies.

I am old enough to remember 25 cent gasoline and shopping in a dime store. Now we paying $4.00 for gas, while our kids shop in the Dollar Store. You can see this decline of value by charting the amount of gold it takes to buy one dollar. Originally worth about 1500 mg (1/20 of an ounce), it has now fallen to about 20 mg – one seventy-fifth of its value in 1900.

Zooming in on the period from 2001 to the present, which also happens to be the period of fastest growth in government debt, we find that the dollar has been declining in a logarithmic fashion, just the way radioactive elements decay. The time it takes for a substance to lose half of it's radioactivity is called its "half-life", and varies depending on the particular material, with some taking thousands of years to lose half their power, and others decaying in tiny fractions of a second.

If you listen to this decay process on a geiger counter, you hear a random clicking, sometimes with bursts of many clicks close together, other times very few clicks, as nuclei disintegrate and give off radiation. But plotted over time, the rate of decay sticks very close to a smooth curve.

The US Dollar also follows just such a curve. Every four years, the purchasing power of the dollar falls in half. From 125 mg in 2001, to about 65 mg in 2005. From 50 mg in 2007 to 25 mg in 2011, and so on. Like random particle decay, it is sometimes above the pure mathematical curve, and sometimes below, but never far away.

If we project this pattern into the future, we see that its value never reaches zero, it simply keeps cutting in half over and over. First to half, then to a quarter, then to an eighth, and so on.  

This is the flip-side of the "miracle" of compounding, where your money doubles after some period, over and over again. Compounding is wonderful for the lender, as long as he actually gets repaid in money that has as much buying power as the money he lent in the first place.

But there's the rub – if it takes 7 years to double your investment by compounding, but the money is halving it's value every four years, as an investor you have a problem!

On the other hand, if you are the borrower, everything is turned upside down. Generating enough cash-flow to pay compound returns to your lenders isn't easy. Borrowing even more to keep things afloat and cover your interest payments just digs you in deeper. But being able to pay the loans back with depreciated dollars is a great help to the borrower.

Returning to the subject of the US Federal debt, the government is faced with the task of paying back an exponentially compounding pile of debt, but it can do so with dollars that are rapidly decaying in value.  So, which side is winning the "tug of war"?

By simply repricing the debt in gold, we can see the answer:

Clearly, for more than a decade, the dollars in which the debt is denominated have been losing value much faster than the debt itself is growing. The massive and growing deficits and endless bailouts, stimulus programs, and rounds of quantitative easing are causing the "bid" for dollars to be lowered faster than those programs add new debt. In fact, currency debasement is crushing the debt explosion, causing it to halve every 5-6 years.

Whether this is due to careful financial and monetary engineering, or just dumb luck, I can't say. But let's follow down the consequences if this pattern continues.

The current federal debt is about 295 kt of gold. The government claims to have 8.13 kt in its reserves. At current rates, those gold reserves will be sufficient to fully collateralize the debt in 5.2 half-lives, or 25 to 30 years. Even that may not be necessary; a return to the debt levels of 1900 (31 kt) will take only 15 to 20 years.

So the good news is that there is a realistic hope of putting government finances back onto a solid footing in the not too distant future, potentially allowing a transition to a redeemable currency without total default on existing obligations. (Of course paying back debts with a debased currency is a sneaky kind of default, but a legal one that people don't seem to complain too much about, for some reason.)

The bad news is what the world will look like for those who keep their books in dollars: in 20 years, dollar prices will be roughly 32 times what they are today. So an ounce of gold might set you back $51,000, gasoline could cost about $128 per gallon, and mailing a first class letter will probably require a $15 stamp (if the US Postal Service is still in existence). Ivy league college tuition will be a million dollars or more per year. It is very unlikely that wages will keep pace, meaning the standard of living for most people will be dramatically lower than it is today.

Owning gold and silver won't make you rich in this scenario. A year of college will probably still require about kilogram of gold, and a silver quarter should be enough to buy a gallon of gas (even with some stiff carbon taxes). But it will preserve the purchasing power of your savings, and leave you in a position to take advantage of the price distortions created by the latest round of lame government regulations. And that might make you rich!

This article was first published in the March 2013 issue of the Journal of the Gold Standard Institute.

0

It was another mixed week, with government currencies and long bonds lower, while stocks and commodities moved higher. Bitcoin, the free market online currency, ended the week up 26% at 849 mg, after recording another all-time high of 893 mg on Wednesday. If you have a time-horizon of a few years, don't let these prices scare you away… Bitcoin has plenty of upside, though it's volatility will be huge. My strategy is to keep position size small, but add a little every week.

The government issued currencies were mostly lower, led by the Japanese Yen, which fell 2% to close at 0.209 mg. The Euro was down 0.7%, and the CAD dropped 0.6%. The USD was unchanged at 19.7 mg, but is now 17.8% above its half-life curve, continuing to move deeper into overbought territory.

Short term bonds (SHY) were unchanged in line with USD cash.  Long bonds (TLT) fell 3.5%, wiping out all of the prior week's gain and more.

Stocks were higher, except for the HUI gold stocks. The big mover, once again, was the Nikkei Index, which rose 3.7% while the S&P 500 and the Dow Jones Industrials each rose 2.2%.  The Gold Bugs Index fell 0.4%, setting another new post-2008 low of 6.72 g on Tuesday, and finishing the week at 6.89 g. The HUI's rate of descent seems to be slowing, so this looks like a good point to be adding to your collection of high-quality mining stocks. Don't worry too much about getting the exact bottom, just keep averaging in. A year from now, you'll look like a genius!

Commodities were all higher, led by Cotton, which rose another 3.9% to close at 17.1 mg/lb. Silver gained 2.8%, while Crude oil was up 1.4%. Platinum gained 0.6% to close at 31.23 g, now 0.4% above gold parity.

Table of prices in gold for week ending 8-Mar-2013

0

It was a mixed week, with most government currencies and most commodities lower. Bitcoin closed Friday on another new all-time high of 673 mg, up 12%. The free market online currency is truly in uncharted waters now, and although serious pullbacks are to be expected as price discovery continues, I would still recommend getting on board now. As Bitcoin's user base is expanding rapidly, there is every reason to expect that the price will be much higher a few years from now – provided, as always, that the currency doesn't blow up! So keep investment positions small enough to suit your risk tolerance.

The government issued currencies were mostly lower, led by the Euro, which fell 1.2%, and CAD, which dropped 1%. The Yen continued it's rise, gaining 0.7%. The USD fell 0.4% to 19.7 mg, now 17.3% above its half-life curve, and still deep into overvalued territory.

Short term bonds were down in line with USD cash.  SHY was off 0.3%, tracking the underlying USD, while the longer term TLT rose 1.2%.

Stocks were mixed. In the US, the S&P 500 fell 0.2% while the Dow Jones Industrials gained 0.3%. The big movers were the Nikkei Index, which rose 2.6% and the Gold Bugs Index which fell another 2.5%, closing at a new post-2008 low of 6.92 g. This is a good point to be adding to your collection of high-quality mining stocks!

Commodities were mostly lower, with the exception of Cotton, which rose another 2.4% to close at 16.4 mg/lb. Silver led the losers, falling 3.1% while Crude oil was 3% lower. Platinum also pulled back this week, finishing down 2.3% at 31.04 g, now 0.2% below parity with gold.

Table of prices in gold for week ending 1-Mar-2013

Filed under monetary universe by  #

2

Another good week for everything but resources, but an exceptional week for Bitcoin, which closed Friday on a new all-time high of 601 mg, up 15.4%. The old high, set back on 9-Jun-2011 at 598.3, was achieved suddenly – tripling from 200 to almost 600 in just 8 days and 188 kg of trading. This time around, it took 100 days and 1349 kg of trades to move from the 200 to the 600 level. It will be fascinating to see whether we continue higher from here, or pull back and spend some time consolidating first.  Either way, some bitcoins should be part of your speculative portfolio. Although the possibility of Bitcoin going bust is very real, the upside potential is huge. If Bitcoin is still around in 5  years, I'd be very surprised if 1 BTC wouldn't buy more than 1 oz of gold.

The government issued currencies were also higher, led by the Yen and the USD, which each rose 2.3%. This puts the USD 17.4% above its half-life curve, and deep into overvalued territory. While it can certainly get even more overvalued, now is the time to start moving out of dollars and into precious metals, farmland, mining stocks and other anti-dollar investments.

Bonds were up in line with USD cash. The short term SHY rose 2.3%, tracking the underlying USD, while the longer term TLT was a bit stronger, rising 2.7%.

Once again, stocks were mostly higher, with the gold miners being the exception. The big mover was the Nikkei Index, which rose 4.2%. The S&P 500 added 2.0% while the Dow Jones Industrials gained 2.4%. The Gold Bugs Index was down 3.0%, setting another new post-2008 low of 6.98 g on Wednesday. While this is getting pretty cheap, keep in mind that the HUI's 2000 low was 4.21 g, about 40% below today's levels.  Still, with the USD so overvalued, it makes sense to begin adding to your collection of high-quality mining stocks.

Commodities were mixed, with Coffee and Cotton rising, and Crude Oil and metals declining. Coffee rose a stunning 6.9% to close at 28.2 mg/lb, while Cotton gained  2.4%. Copper gave up all of last week's gains and then some, falling 3.2% to close at 69.8 mg/lb. Silver lost 2.4% while Crude oil was 0.6% lower. Platinum also pulled back this week, finishing down 1.7% at 31.78 g, now 2.2% above parity with gold.

Table of prices in gold for week ending 22-Feb-2013

Filed under monetary universe by  #

0

In a week when most assets turned in excellent performances, bitcoin once again outshone all others. The only things that lost ground this week were mining stocks and silver.

Currencies were all higher, led by bitcoin, which added an astounding 24.6% to close at 520.7 mg, within spitting distance of its all-time high of 598 mg.  In fact, in all of bitcoin's history, there are only 3 days on which it was traded at higher levels.

Among government issued currencies, the Yen gained 3.7%, more than recouping last week's losses, and the USD rose 3.5% to close at 19.3 mg. This puts the USD 14.4% above its half-life curve, and solidly in overvalued territory. Keep in mind that just because it's overvalued don't mean it can't get even more overvalued! Back in 2005 and 2008 it was more than 20% overvalued.  Still, for the long term investor, this is a great time to be moving out of dollars and into precious metals, farmland, and other anti-dollar investments.

Bonds were up, but did not rise as strongly as USD cash. The short term SHY rose 3.4%, slightly less than the underlying USD, while the longer term TLT was up "only" 2.9%.

Stocks were mostly higher, with the gold miners being the exception. The big mover was the Nikkei Index, which rose 3.7%, recouping all of last week's loss and then some. The S&P 500 added 3.6% while the Dow Jones Industrials gained 3.4%. The Gold Bugs Index lost 2.7%, wiping out all of last week's small gain, and setting a new post-2008 low of 7.32 g. With gold stocks this cheap, and the USD so overvalued, this is a great time to be adding to your high quality gold stock positions.

Commodities were all higher except for silver, which lost 0.9% this week. Crude oil made the greatest gains, rising 3.6% to close at 1.85 g/bbl. Copper was also strong, up 2.9%. Platinum continued its rally, finishing up 1.2% at 32.33 g, now 4% above gold parity.

Table of prices in gold for week ending 15-Feb-2013

1

Recently, I got a great question about compound interest.  Everyone is taught the power of compounding… Usually the story goes something like "If you invested $1,000 in 1900 at 5% compound interest, it would be worth $236,000 today!".

If 100 years works that well, why not leave the money to compound for 300 years?  Then your heirs would have $2.3 billion!  Why doesn't everyone do this?  Because while this may be mathematically true, in the real world, it is riddled with problems.

Let's look at some examples.  What is the value of 1000 Dollars placed on deposit at 5% in 1863 and left to compound for 150 years? If you lived in Atlanta, Georgia, and they were Dollars issued by the Confederate States of America, are they now worth $1.5 million as the math would predict? Or something closer to, oh, I don't know, maybe ZERO?  The same goes for the value of 1000 Zimbabwe Dollars put on deposit at 5% in 1970 and left to compound for 43 years.  Even with a world-beating return of 25% per year, compounded for 43 years, or 150 years, you would still be dead broke.

There are so many risks in such an investment… including the bank or institution holding your money.  They could go out of business – think MF Global. They could be crooks.  Think Bernie Madoff.  Even if your deposits are insured, the insurance issuer could go bust. And even if you dodge these bullets, the money itself could become worthless, as in the examples above.

But enough ragging on currency failures of the past.  What about the good old US Dollar? To make a concrete real-world case, I took the 1 year treasury bill rates from the Federal Reserve website, and calculated the compound growth of buying t-bills at a discount each year, and reinvesting the proceeds each time they matured.  I started in July 1959 because that's where the Fed's dataset starts. I chose 1 kg of gold (worth $1,128.49 in 1959) as the initial investment, and plotted the gold value of the investment each year, up to July of 2012.  Here is the chart:

Value of 1kg invested in 1 Year T-Bills with compound interest

Over this 52 year period, interest rates varied from 14.25% in 1982 to 0.2% in 2012. The initial $1,128 invested grew to $21,129 in 2012. But those $21,129 dollars could only buy 405 grams of gold in 2012, 59% less than the initial investment.

Over the 52 year period, the investment was in the black about 40% the time, and underwater the other 60%. At this point, currency debasement is totally overwhelming the compounding effect.

Never forget that US Dollars (like all other government currencies) are irredeemable. That means that although you can trade USD for many goods and services – even gold – in the market today, no bank or government agency is required to redeem your dollars for anything. At some point, market confidence in the dollar will fade, and the bid for dollars will shrink. And shrink some more. And then the bid for dollars will be withdrawn.  That's Zimbabwe Time! To learn more about the details of this process, I recommend visiting Keith Weiner's Monetary Metals website. Keith has put together some excellent videos on this topic.

When the music stops, you don't want to be stuck holding the Old Maid. Be sure you have some physical gold in your posession. And for pete's sake, measure your investment results in gold, not dollars!

0

Bitcoin continued to rocket upward this week, with long term treasuries a distant second place. Coffee and the Nikkei Index were the biggest losers.

Government issued currencies were mixed, with the Yen down 2.6% and the Euro down 0.5%, while the Canadian Dollar rose 0.5% and the US Dollar was unchanged. In contrast, the free market currency, Bitcoin, gained 8.2% to close at 418 mg. The BTC is up 62% in the last month.

Bonds were up. The short term SHY rose 0.1%, slightly better than the underlying USD, and the longer term TLT was up 1.2%. Despite this week's good showing, TLT is still down 5.4% for the year to date.

Stocks were mixed. The big movers were gold stocks, represented by the HUI, up 0.8%, and the Nikkei Index, which fell 3%.  In the US, the S&P 500 rose 0.4% while the Dow Jones Industrials fell 0.1%.

Commodities were all lower except for silver, which gained 0.3% this week. Coffee was the weakest, falling 4.6%, followed by crude oil, down 2.1%. Although not in the table below, platinum was up 1.7% this week, and now sits 2.7% above parity with gold. Food prices were up 3.7% in January, but are still close to their lows.  The UN's Food Price Index is currently at 45.1, less than half of its 2005 level.

The DJIA made headlines as it hit the magic "14,000 USD" level this week, approaching its pre-crash 2007 highs.  But keep in mind that at the 2007 peak, the Dow was selling for 652 g.  Today, it sells for 261 g, a loss of 60%. Don't be fooled into measuring your investments with a rubber ruler like the USD. Always measure your results in gold!

Table of prices in gold for week ending 8-Feb-2013